Damages During Road Construction Projects

by Keeshawn Aleksuk and Robert Strachota

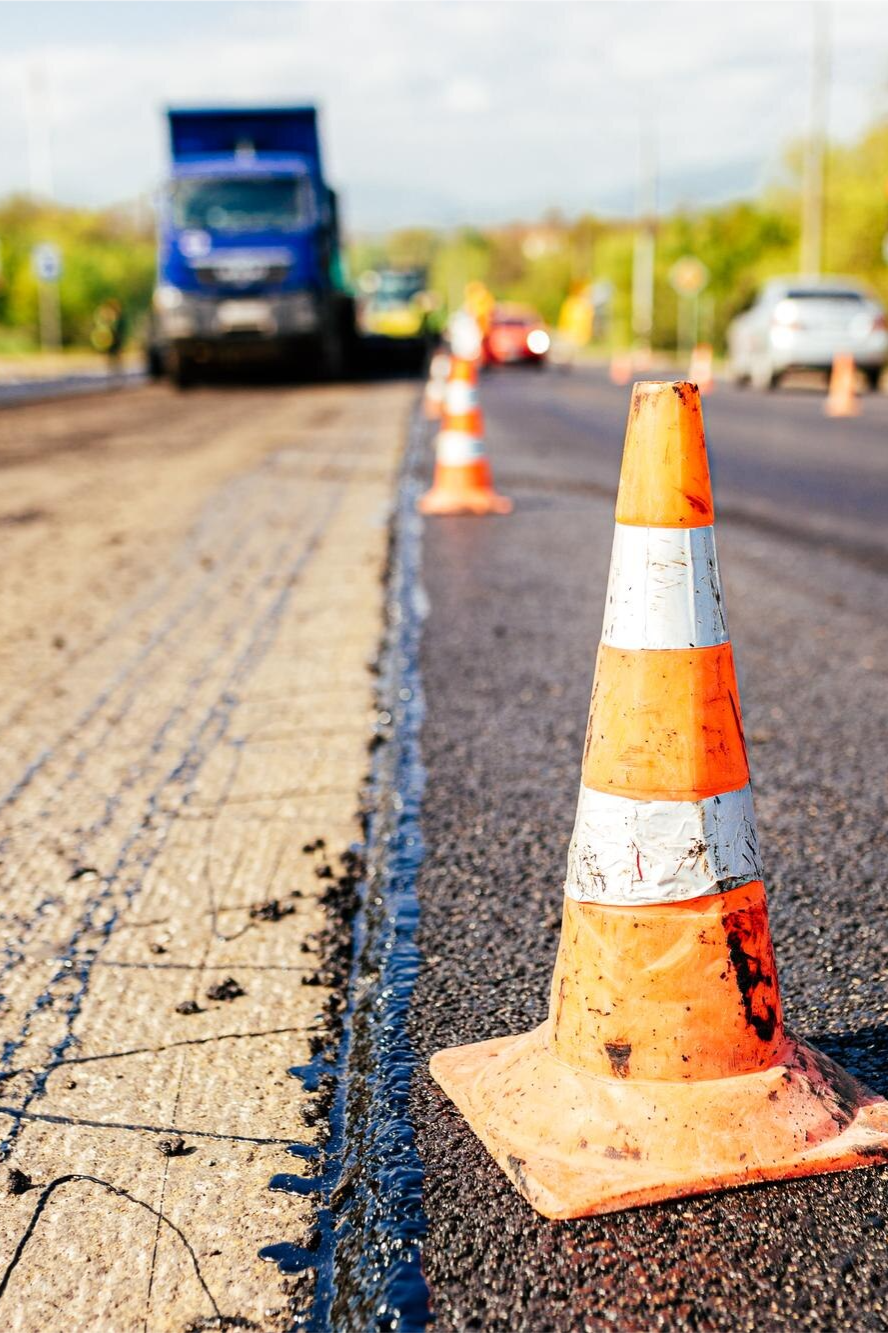
In the real estate world, the government has the legal power to take all or a portion of private property if the property is necessary for public use.  Just compensation is the payment the government has to pay for taking private property.  This process is referred to as eminent domain – the government’s power of condemnation.  Just compensation in eminent domain is measured as the “fair market value” of the property, or the hypothetical price the real estate would bring after fair and reasonable negotiations between willing buyers and sellers as of the date the property is taken.  In the appraisal industry of real estate, appraisers find the difference of the property’s value before the taking (before value) less what it is worth after the taking (after value), with the difference being the just compensation due to the property owner.  Additionally, it should be noted that there are at least three categories of damages that need to be addressed to correctly provide just compensation during eminent domain: the direct taking of real property, construction damages, and permanent severance damages.

  • Direct taking refers to the “fair market value” of the private property that is being taken during condemnation.
  • Construction damages refer to the damages to the property from construction-related interference that occur on and after the date of taking. (All of the property, not just the portion being taken.)
  • Permanent severance damages refer to the amount of damage to the remainder of the property when a portion has been taken during condemnation. (Result from Construction damages + Permanent diminution of value to the remaining property)

An appropriate condemnation action will address all three categories of damages.  However, the government

oftentimes neglects the construction damages category since these damages can occur for several years after the actual date of taking and, in the government’s opinion, are often considered non-compensable.  Therefore, it is the appraiser’s ethical responsibility to find how the market reacts to all the government’s activity in an eminent domain action.

Historically, construction interferences would most often occur no more than one year, making it difficult in the marketplace to measure these damages.  When analyzing a property with a construction period of a year or less, it is challenging for the appraiser to track how the road construction project is damaging the whole property since there is a limited amount of market evidence regarding short-term impacts to many different types of properties.

However, when damages during construction are greater than one year (let’s say a period of three, four, or even five years), the appraiser can track the performance trends of the marketplace and property at hand, clearly recognizing the diminution of value to the property.  The evidence can be seen in the cost approach (more depreciation, functional or economic obsolescence), income approach (a decrease, slight, or even no cash flow coming from the property when examining the DCF), and the sales approach (adjustments made for the conditions of sale or expenditures made immediately after purchase – for example, to bring the property back to its “before” state).

There has been evidence of these damages being upheld in Minnesota law in two cases: 1992 Minnesota Supreme Court Decision State v. Strom, 493 N.W. 2d 554 (Minn. 1992) and County of Hennepin v. Laechelt, A19-0473 (Minn. 2020).

1992 Minnesota Supreme Court Decision State v. Strom, 493 N.W. 2d 554 (Minn. 1992): Evidence regarding often changing and difficult access routes was a form of construction interference evidence that could be considered by the fact finder in the case.  Additionally, the Court held that evidence of noise, dust, and vibrations generated by the project could also be considered by the fact finder.

Evidence: During construction the occupancy of the office building (subject) at issue dropped from 91.6% to 56.7%, and the net rental rate dropped from $10.59 per square foot to $7.90 per square foot.  Evidence of these temporary losses in the ability of the property to generate revenue is admissible in a condemnation case.

County of Hennepin v. Laechelt, A19-0473 (Minn. 2020): Evidence of construction-related interference that comes into existence after the date of taking – “simply provides the benefit of hindsight.”  Such evidence “may shed light on what a willing buyer and seller might reasonably expect” as of the date of taking.

Evidence: Property owner’s submitted photographs and testimony of how the construction project impacted her property.

In conclusion, an experienced appraiser strives to mirror the full behavior of the marketplace.  It is the appraiser’s responsibility to show all consequences of an eminent domain action.  It is the courts responsibility to decide what is legally compensable.  Thus, the appraiser should discuss and display all damages so the court can clearly understand how buyers and sellers handle the consequences of a road construction project.

Supply Chain Crisis

by Thomas Bauer

Amid the recovery from the Covid-19 pandemic, the global economy was hit with yet another major setback:  a supply chain crisis.  Global supply chains have been under extreme pressure recently, with several major transportation and logistics companies reporting backlogs at ports of entry and lost cargo.   These delays have been caused by several factors:  worker shortages, surging demand, low safety stocks, and high commodity volatility.

The United States is currently experiencing the worst worker shortage in decades.  The recent jobs report from the Bureau of Labor Statistics stated that the economy added 315,000 jobs in August. Wages continue to rise, albeit at a slower pace than overall inflation. The job market is still very strong and demand for workers outpaces supply. At the end of June, there were still nearly twice as many jobs openings as unemployed workers.  This worker shortage has hit the transportation industry particularly hard, resulting in an estimated 80,000 unfilled semi-truck driver positions in 2021.  This shortage has made it difficult for shipping companies to bring goods to and from ports to stores, resulting in further congestions at ports and ultimately, goods left to sit on container ships.

As the economy emerged from the Covid-19 pandemic, consumers found themselves with higher disposable incomes than they had seen since 2019.  This was driven by more people returning to work, as well as stimulus checks, leaving people with extra cash.  Further, with inflation being high, 8.5% annually as of the end of July, consumers have little incentive to save this money, as its purchasing power dwindles, with long term interest rates well below inflation.  This has caused demand for many goods to rise beyond what analysts had forecasted, resulting in shortages of goods.  This supply chain crisis has been particularly hard felt by consumers, due to the popularity of lean and just-in-time (JIT) operation strategies.  In an effort to cut costs in an increasingly competitive global economy, many companies have adopted operational and manufacturing strategies that involve holding minimal inventory, allowing for a more efficient use of capital.  However, this has resulted in a decrease in the safety stock held in warehouses across the country.  When shipments from ports became delayed, companies had no extra inventory they could draw on to sell to consumers. As such, shelves in stores across the country are left unstocked.

The war in Ukraine has also had an adverse effect on the health of global supply chains through rising prices of commodity items.  When Russia invaded Ukraine in March 2022, western power placed harsh sanctions aimed to punish Russia for its military actions. These sanctions prevented the importation of many key goods from Russia.  Russia and Ukraine are major producers and exporters of wheat, corn, and oil.  The disruptions of global commodities have led to sharp increases in both future and spot prices, which has in turn increased the price of consumer goods derived from these commodities, like food and gasoline.

These supply chain issues have affected nearly every industry, but certain industries have been hit harder than others.  For example, the automotive manufacturing industry, an industry known for its use of lean and JIT manufacturing, has seen rising prices and shortages of important components.  Automotive manufacturers were forced to cut unit production in 2020 and 2021 after sourcing departments were unable to acquire semi-conductor chips for their vehicles.  Semi-conductor chips, also known as microchips, are used in almost every electronically controlled system in modern vehicles, like cruise control, airbags, and lights.  As a result, there is a massive shortage of new and used vehicles on the market.  This has caused the average used car price to increase 36.9% between January 2021 and January 2022.

Another good that has been uniquely affected by these issues is baby formula.  Demand for the product outpaced analysts’ expectations, leaving grocery store shelves bare and parents unsure where they can find this essential product.  Manufacturers have struggled to increase production, as their efforts have been met with difficulty in obtaining ingredients and packaging materials, as well as securing transportation to warehouses and store shelves.

In the short-term, companies may see lower revenues and higher transportations costs as they struggle to source their raw materials and get finished products to shelves.  In the long-term, companies may move away from lean and JIT operations by maintaining higher levels of inventory to avoid future supply chain issues. An industry-wide increase in inventory would increase the level of working capital companies maintain.  Since working capital typically provides a lower return to shareholders than alternative uses of capital, we may see lower overall returns for companies.  While a lower level of returns could lower company valuations, the lower level of risk associated with profits may offset this impact. The result may be companies that have less risky, less efficient operations as a way to mitigate supply chain risk.

Trends in Price to Earnings Ratios for Public and Private Companies

by Cody Lindman

he price to earnings ratio (P/E) is one of the most widely used metrics in the valuation of companies. As the name suggests, the P/E ratio is calculated by dividing the price of one share of a company’s stock by the company’s earnings per share. Although commonly used as a relative measure of valuation between companies in the same industry, it can also be beneficial to compare P/E ratios for a specific company or index over time.
In particular, the Standard and Poor’s 500 (S&P 500) P/E ratio is closely followed by investors and analysts because it is believed to provide a reading on the temperature of the overall stock market. As of December 31, 2021, the P/E ratio of the S&P 500 was 30.0, a level significantly above the long-term average of 16.0 since 1871, yet below the levels experienced during the dot-com bubble and the 2007-2008 financial crisis. Additionally, the S&P 500’s P/E ratio of 30.0 as of December 31, 2021 was above the five-year historical average of 26.7, yet below the 2021 average of 32.2. Due to lower interest rates in response to the COVID-19 global pandemic, P/E ratios have increased significantly since December 2019. In the near term, we expect P/E ratios to decrease as a result of both higher interest rates and inflation. However, the decrease may be muted as a projected increase in interest rates and inflation is likely already priced into the market.

Unfortunately, one is not able to readily calculate the P/E ratio of a privately held company. Instead, investors and analysts look at transactions involving privately held companies and then calculate a variant of the P/E ratio called the selling price to earnings before interest and taxes ratio (Price/EBITDA). The Price/EBITDA ratio is calculated by dividing the selling price of a business by its EBITDA. Although the formula is slightly different, the P/E ratio and the Price/EBITDA ratio should follow the same trends, although they are not directly comparable. One of the best resources for data on Price/EBITDA ratios for privately held companies is the DealStats Value Index, which is published by Business Valuation Resources. According to the fourth quarter DealStats Value Index, the Q3 2021 median Price/EBITDA multiple for private company transactions was 4.0, a level slightly above the three-quarter average of 3.8, yet below the five-year average of 4.4. Since peaking at 5.6 in Q3 2018, the Price/EBITDA ratio has generally declined, hitting a low of 3.3 in Q1 2021. The chart below showcases the DealStats average Price/EBITDA ratio since Q4 2015.

The data suggests that the valuations of publicly and privately held companies have taken divergent paths over the past five years. As of December 31, 2021, the S&P 500 P/E ratio was 27.3% greater than the December 31, 2016 P/E ratio. In contrast, the average Price/EBITDA ratio for privately held companies as of Q3 2021 was 2.4% lower than the average Price/EBITDA ratio as of Q4 2015. One possible explanation for the declining median Price/EBITDA ratio for private companies is an increase in the “size premium.” The “size premium” is the tendency for larger companies to typically trade at higher multiples than smaller companies; due to being perceived as less risky and having greater access to capital. Further analysis of the data supports our hypothesis; as shown in the chart below, median Price/EBITDA ratios for privately held companies with less than $10 million in revenue declined between 2016 and Q3 2021. In contrast, median Price/EBITDA ratios increased slightly for private companies with more than $10 million in revenue.

Another possible reason is that the types of businesses that are typically publicly held or privately held differ. For example, although they are privately held during their early stages, technology firms typically go public eventually. Additionally, as the world economy has become more dependent on technology, the valuation of technology firms has risen steeply over the past five years, with the S&P 500 Information Sector index returning an annualized 28.93% over the past five years.

Regardless of the reason for the divergence in the valuation trends of public and private companies, the data clearly shows that small privately held companies have underperformed both larger privately held companies and public companies in general over the past five years. In the near term, we expect small privately held companies to continue to underperform both larger privately held companies and public companies due to small private companies typically experiencing greater negative effects from higher interest rates and inflation.

COVID Impact on Valuations

by Madeline Strachota

Since March of 2020, clients have asked us about the impact of COVID on the value of their business or real estate. We believe that there is no one-size-fits-all, uniform “COVID discount” nor “COVID premium.” Sectors of the economy have encountered different positive and negative microeconomic impacts from COVID. In fact, sub-sectors of the economy have been impacted differently by COVID. Even within those sectors, the underlying fundamentals of businesses have led to various outcomes. In the hardest hit sectors of the economy, companies with strong fundamentals have been able to weather the storm better than similar companies without strong fundamentals. In sectors where there has been growth opportunities from COVID, companies that have quickly scaled their online, curbside, or delivery sales, have faired better than their competitors who were not as nimble. For example, we appraised a business that saw a 75% increase in annual sales during the global pandemic because they were prepared to serve customers through online sales.

Given this variety in outcomes, the impact of COVID on business and real estate valuations poses a unique challenge to appraisers. It requires forecasting cashflows and determining discount rates when the future of COVID is opaque. It also requires particular attention to detail when analyzing comparable sales. We have noticed a trend among business and real estate owners during this time. For sectors of the economy that have benefited from the COVID impact, business owners are eager to sell. Oftentimes, owners in these sectors want to sell when their cashflow is up, hoping to convince buyers that what may be a short-term uptick in cashflows is a sustainable increase to the bottom line. Alternatively, we have observed many businesses and real estate owners delay sales of their businesses or real estate in the most negatively impacted sectors to avoid a perception problem. So, many of the business and real estate transactions in negatively impacted sectors have been sales where the operator did not have strong fundamentals underlying their business. For example, highly leveraged real estate in badly hit sectors, such as central business district hotels, may have undergone financial distress, causing the owners no option but to sell at a discount to intrinsic value.

Therefore, the sales comparison approach to value presents unique challenges right now—are the sales of like-kind property really comparable to the assets being appraised? Although the real estate may be the same property type, in a similar location, the sale must be analyzed to determine if it was a sale under distress that caused a depression in price beyond the intrinsic value of the asset. Furthermore, sales of real estate or businesses in booming sectors of the economy must be analyzed to determine if the forecasts assumed overly optimistic long-term performance. For example, in the business where we observed a 75% increase in sales, we determined that some of the change in consumer preferences for this brand’s products will be sustainable, although the sales will largely return to pre-COVID levels and growth rates in the future.

In summary, a thorough financial analysis on a case-by-case basis is necessary to determine if a “COVID discount” or “COVID premium” is applicable to a business or real estate. So, be cautionary when receiving a cursory answer to the question—what is the COVID impact on value?

Rising Inflation in America

by Thomas Blomgren

One of the major talking points over the past year has been rising inflation in the United States economy. Whether it be at the gas pump, grocery store, or in workplace wages, rising prices have touched just about every part of life. According to the Bureau of Labor Statistics, U.S. inflation increased at a greater annual rate in 2021 than any other 12-month period since 1982, creating a 39-year high. The consumer price-index rose 7% in December from the same month a year ago. This rise in prices can be attributed mostly to strong consumer demand paired with supply chain constraints and shortages. Rises in inflation affect consumers and companies in a multitude of ways. Large inflation gains erode the purchasing power of consumers in the marketplace. However, this rise in prices encourages people to spend and invest more in the short term, due to the lower value of holding cash. Then again, this spend-and-invest cycle will only accelerate inflation due to increased demand, creating a vicious cycle of rising prices. The rise in prices has not been felt equally across different industries. For instance, used auto prices have skyrocketed due to a semiconductor shortage that greatly limits the supply of new cars. Meanwhile, prices for services centered around education and medical care have risen just slightly. Also, rising inflation has led to higher wages in the workplace. Having said that, the gains in wages are dulled by the effects of inflation. According to a CNBC article dated November 10, 2021, the average wage growth year over year through October 2021 was 4.9%. However, when accounting for inflation, real hourly wages have decreased by 1.2% in that same time period. Currently, the Federal Reserve is discussing multiple interest rate increases in the next year aimed at slowing inflation, although it is unclear how these increases will affect the economy and the spending power of workers over the year to come.

Reuse of Existing Structures

by Brock Boatman

Adaptive reuse of existing properties continues to be an interesting development opportunity in the Twin Cities, particularly in downtown Minneapolis. However, the data suggests that not all opportunities are equal. The simple example is the continued conversion of aged warehouses and offices in the North Loop, where conversion to residential uses has been well established for years. A recent example of a new project that is underway is Solhem’s Security Warehouse conversion to apartments. Including new construction and properties still in lease-up, downtown Minneapolis apartment vacancy is still near 5%, with starting rent near $1,700. Reuse in this market sector is still well received, although new opportunities are diminishing as supply dries up.

In another adaptive reuse market, owner-users are still being drawn to the Downtown Minneapolis market. A recent example is the purchase by the Red Lake Nation to create a new student campus near US Bank Stadium. The Nation recently purchased the former Tiger Oak Media building and the adjacent properties for use as a new campus for their college. Previously, the buildings here had been a combination of offices, retail, industrial, among other uses in their 100 years of existence. Conversion to a classroom and administrative offices was a natural fit for an owner-user willing to invest the dollars to make these well-located structures beneficial to their cause.

The Rand Tower conversion to a hotel at the end of 2020 was unfortunately poorly timed yet helps demonstrate that existing structures that may no longer be viable as an office use can still find a purpose for reuse. While all hotels have experienced challenges over the last two years, the historic structure located in the heart of Downtown Minneapolis is currently experiencing above average occupancy rates as of the beginning of 2022 and reaching more than 80% occupancy on weekends and event nights – particularly Vikings games and other US Bank events. The Rand Tower conversion took obsolete office space off the market and created a new use that the market is utilizing. The largest reuse space is the Dayton’s project. Finally opening in early 2021, this million square foot project has only secured one major tenant, Ernst and Young. This project, with an extensive amenities package that not all developments can provide, does present a unique challenge; the large floor plans cannot easily accommodate a user smaller than around 5,000 square feet. This requires the project to find more home run type tenants in order to stabilize, a challenging prospect given space that has become available in City Center and the relocation of RBC. The Dayton’s project was always going to be a risky venture as a speculative development, and the unforeseen challenges of the last two years only added to the risk undertaken by investors and lenders.

Adaptive reuse of existing properties is always going to be a challenging undertaking, and the market’s reception can be mixed; however, we would expect to see continued development of this type with investors with the right creative mind and opportunities to keep these projects moving forward.

State of the Real Estate Market

by Robert Strachota and Ellis Beck

Over the past year, we have seen continued growth in real estate. Here is a breakdown by market type.

Single Family Residential

Determining what is normal in these abnormal times is a challenging proposition. Pending sales contracts of single-family homes were up 0.8% from November 2020 and up 15.9% from November 2019. Over the last decade, home prices might have increased in the range of 3% to 5% per year. Year over year increases over the past 12 months show an increase of 8% to 9%. The median sale price of a home that sold in the 16-county Twin Cities region from November 2020 through November 2021 was $340,000. The average home sat on the market for just 27 days, and there is no indication that the spring 2022 market will bring relief for buyers.

Apartments

The apartment market seems to be returning to its pre-pandemic trend of growth at a slower pace. Rent increases this past summer were flat but now are edging up again. However, suburban rent hikes largely exceeded those of the urban submarkets. At the end of 2021, trailing 12-month net deliveries are near an all-time high, with approximately 12,000 units currently under construction. Metro-wide occupancy is near 95%, which for most of us reflects a balanced rate for a long-term investor. The slowdown in renter demand in the Minneapolis city core, and St. Paul, will most likely continue moderate rent growth for the foreseeable future. Concessions and other incentives should remain common through early spring 2022. Twin Cities rental growth is currently 3.6%, exceeding the area’s five-year average yet trailing national markets.

Hotels

Unfortunately, business travelers are not back; the leisure traveler has the travel bug. Explore Minnesota has found that people are ready and willing to engage in leisure travel this winter. Roughly 82% of surveyed Minnesota travelers planned domestic U.S. trips this winter. Approximately 50% plan to visit destinations more than 500 miles from home, and approximately 48% of those surveyed are planning trips that include time in Minnesota. Generally, travelers expect pre-pandemic levels of customer service, product quality, and pricing. For those who will not be traveling, COVID-19 is the top reason for not planning to travel in the next six months. Obviously, new variants of COVID-19 and restrictions surrounding them are the wild card in any projection of the future of the local hospitality market. The downtown hotel market is struggling as reflected by recent sales of the Marquette and Westin hotels. The Marquette traded at a loss of $14 million from the 2016 acquisition price of $74.5 million, a 19% loss. And the Westin, which sold for $66.4 million in 2015, sold for just $47.2 million in October, a 29% loss.

Manufacturing

Minnesota has over 8,300 manufacturers making a wide range of products. Manufacturing is growing in Minnesota with employment in this sector rising over 11% since 2020. Real estate used for manufacturing is not constructed on a speculative basis. Usually, a manufacturing facility is built for a specific user. When that user grows and needs a new building, they leave behind a second-generation manufacturing building that is available for a startup. The opportunities to build new manufacturing space and the availability of second-generation space are balanced in terms of supply and demand. Numerous government incentives supplement all manufacturing startups. In summary, Minnesota manufacturing has strength in a broad range of industries. It has momentum to grow, but there is an acute shortage of workers that will keep the lid on expansion for the near term.

Warehouses

There appears to be no end in sight for the industrial warehouse boom. Despite clogged supply, demand for major distribution facilities and warehouses seems to be “off the charts” in the Twin Cities. Other regional hubs like Dallas, Atlanta, Chicago, and Denver are experiencing the same shortages of space.

The pandemic has accelerated the already growing trend of e-commerce. Some call this the Amazon Effect. To manage growth, businesses of all types are leasing space to store more inventory and reduce reliance on material supply flows. Despite rampant new development, record-setting demand has kept the Twin Cities vacancy rate below 4% for 22 consecutive quarters. The strongest performing industrial market in the Twin Cities is the Northwest submarket.

Retail Malls

Considering the economic damage brought on by the one-two punch of the pandemic and civil unrest, the Twin Cities retail market has been somewhat resilient in the past two quarters. The retail sector is made up of several submarkets, such as malls and big box stores. In the Twin Cities, these markets make up 29,700,000 square feet. There is virtually no new construction, and there won’t be for many years. These sectors are plagued by big box store closures and bankruptcies of numerous tenants. Most landlords have sued dozens of tenants for overdue rent in 2021. All malls continue to see foot traffic down compared to pre-pandemic levels. Even the metro’s “best in class” malls are suffering from the pandemic’s impact. Older malls and areas with below-average demographics are having the most difficulties backfilling large scale vacancies. Reported vacancy rates for market power centers are in the 11% to 12% range. It is likely that the vacancy rates reflect the occupancy level but not the amount of rent being paid; we at Shenehon believe that landlords may only be collecting 80% of all rent due. Rental rates in these sectors have been flat at $20 to $30 per square foot plus operating expenses, and they will not show any meaningful increase for the next one to two years. For malls in particular, creativity is the theme as landlords and developers will reconfigure and redevelop obsolete or underperforming retail spaces. The goal of the creativity is to explore unique venues that will draw traffic and again engage the consumer’s interest. Despite the e-commerce expansion, most retailers are confirming their commitment to brick-and-mortar retail.

Community Strip Centers

Community Strip Centers have not received the same amount of negative pressure from COVID-19. While the pandemic nearly gave the malls and power centers the “knock-out punch,” certain retail segments (i.e. grocers, pet supplies, coffee, sporting goods, alcohol, discount clothing, and home improvement supplies) were propelled by the pandemic. How many of you wait in drive-through lines for your Starbucks or Caribou coffee? Most of us, even at the height of the pandemic, were visiting our community/neighborhood strip centers with more regularity than in pre-pandemic times because we were not traveling out of town. As with anything, there are exceptions to this rule, with restaurants being the biggest example. It is anticipated that restaurants will likely be the area of this sector to recover.

TC Office Market

The Metropolitan Twin Cities downtown office market, which is composed of 46,100,000 square feet, reached an all-time high vacancy rate in the third quarter of 2021. This 46.1 million square foot market includes all Class A, B, and C buildings. Think of the total office space as the equivalent of 30 IDS buildings in a row. The current vacancy rate as of January 1, 2022, is 14.3% of all space, or 6,700,000 square feet. This is as if we had four and a half empty IDS buildings. While we have not returned to pre-pandemic levels of downtown office vacancy, we are seeing improvement.