Trends in Price to Earnings Ratios for Public and Private Companies
by Cody Lindman
he price to earnings ratio (P/E) is one of the most widely used metrics in the valuation of companies. As the name suggests, the P/E ratio is calculated by dividing the price of one share of a company’s stock by the company’s earnings per share. Although commonly used as a relative measure of valuation between companies in the same industry, it can also be beneficial to compare P/E ratios for a specific company or index over time.
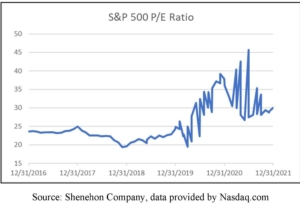
In particular, the Standard and Poor’s 500 (S&P 500) P/E ratio is closely followed by investors and analysts because it is believed to provide a reading on the temperature of the overall stock market. As of December 31, 2021, the P/E ratio of the S&P 500 was 30.0, a level significantly above the long-term average of 16.0 since 1871, yet below the levels experienced during the dot-com bubble and the 2007-2008 financial crisis. Additionally, the S&P 500’s P/E ratio of 30.0 as of December 31, 2021 was above the five-year historical average of 26.7, yet below the 2021 average of 32.2. Due to lower interest rates in response to the COVID-19 global pandemic, P/E ratios have increased significantly since December 2019. In the near term, we expect P/E ratios to decrease as a result of both higher interest rates and inflation. However, the decrease may be muted as a projected increase in interest rates and inflation is likely already priced into the market.
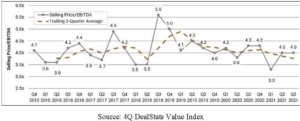
Unfortunately, one is not able to readily calculate the P/E ratio of a privately held company. Instead, investors and analysts look at transactions involving privately held companies and then calculate a variant of the P/E ratio called the selling price to earnings before interest and taxes ratio (Price/EBITDA). The Price/EBITDA ratio is calculated by dividing the selling price of a business by its EBITDA. Although the formula is slightly different, the P/E ratio and the Price/EBITDA ratio should follow the same trends, although they are not directly comparable. One of the best resources for data on Price/EBITDA ratios for privately held companies is the DealStats Value Index, which is published by Business Valuation Resources. According to the fourth quarter DealStats Value Index, the Q3 2021 median Price/EBITDA multiple for private company transactions was 4.0, a level slightly above the three-quarter average of 3.8, yet below the five-year average of 4.4. Since peaking at 5.6 in Q3 2018, the Price/EBITDA ratio has generally declined, hitting a low of 3.3 in Q1 2021. The chart below showcases the DealStats average Price/EBITDA ratio since Q4 2015.
The data suggests that the valuations of publicly and privately held companies have taken divergent paths over the past five years. As of December 31, 2021, the S&P 500 P/E ratio was 27.3% greater than the December 31, 2016 P/E ratio. In contrast, the average Price/EBITDA ratio for privately held companies as of Q3 2021 was 2.4% lower than the average Price/EBITDA ratio as of Q4 2015. One possible explanation for the declining median Price/EBITDA ratio for private companies is an increase in the “size premium.” The “size premium” is the tendency for larger companies to typically trade at higher multiples than smaller companies; due to being perceived as less risky and having greater access to capital. Further analysis of the data supports our hypothesis; as shown in the chart below, median Price/EBITDA ratios for privately held companies with less than $10 million in revenue declined between 2016 and Q3 2021. In contrast, median Price/EBITDA ratios increased slightly for private companies with more than $10 million in revenue.

Another possible reason is that the types of businesses that are typically publicly held or privately held differ. For example, although they are privately held during their early stages, technology firms typically go public eventually. Additionally, as the world economy has become more dependent on technology, the valuation of technology firms has risen steeply over the past five years, with the S&P 500 Information Sector index returning an annualized 28.93% over the past five years.
Regardless of the reason for the divergence in the valuation trends of public and private companies, the data clearly shows that small privately held companies have underperformed both larger privately held companies and public companies in general over the past five years. In the near term, we expect small privately held companies to continue to underperform both larger privately held companies and public companies due to small private companies typically experiencing greater negative effects from higher interest rates and inflation.