Economy and Real Estate Market View – Q3 2016

In spite of lingering global economic concerns, the U.S. economy continued to expand through the first nine months of 2016.  According to the latest Beige Book, most districts indicated a modest to moderate pace of growth, and the overall economic outlook for the U.S. economy remains positive.  Providing an optimistic outlook, labor markets remain tight, retail sales and real estate markets are healthy, and the oil and gas markets are beginning to demonstrate signs of stabilization.

Despite an encouraging overall outlook, commodity prices continue to be a source of some concern.  Weakness in commodity prices continues to weigh on the manufacturing and agricultural sectors, with strong yields putting deflationary pressures on food prices.  Although stabilizing around $45 per barrel, spot oil prices remain significantly lower compared to the close of 2013, putting significant pressure on energy-related firms.  Weakness in the energy sector, combined with the strength of the dollar, continues to hold back growth and a more encouraging outlook for the manufacturing sector, with eight of the 18 manufacturing industries reporting contraction in October.

In the face of challenges within a number of industries, the manufacturing sector as a whole continues to keep its head above water.  According to the ISM Report on Business®, the PMI® was recorded at 51.9% in October of 2016, up slightly from 51.5% recorded in the month prior and 50.1% noted in October of 2015.  In comparison, economic activity in the non-manufacturing sectors expanded for the 81st consecutive month in October of 2016.  The following graph presents the five-year historical PMI® and NMI® index readings.

pmi-and-nmi

Non-farm employment at the national level increased by 1.8% over the year ended September of 2016 on the net addition of nearly 2.5 million jobs.  Job growth in the service-producing sectors is leading increasing overall payroll figures, with the most robust gains noted in the professional/business services and education/health services sectors.  From a year-over-year perspective, payroll figures in the service-producing sectors increased by 2.0% in September, followed by the government/public sector (0.8%) and the goods-producing sectors (0.3%).  The following graph presents overall national non-farm employment growth.

non-farm-employment

Employment gains noted across nearly all major markets continue to put downward pressure on unemployment rates.  Nationally, the non-seasonally adjusted unemployment rate decreased to 4.8% in September of 2016, down 20 basis points from 5.0% recorded 12 months prior.  In comparison, the non-seasonally adjusted unemployment rate in the state of Minnesota stood at 3.4% in September of 2016, down 40 basis points from 3.8% recorded in the prior month but up 20 basis points from 3.2% in September of 2015.  From a statewide perspective, unemployment remains lowest in the Mankato and Rochester markets (2.8%), followed by the Twin Cities (3.3%) and St. Cloud (3.3%) markets.  The following graph presents non-seasonally adjusted unemployment rates at the national, regional, and local levels.

unemployment

In addition to a tight labor market, retail sales and real estate markets remain healthy to facilitate economic growth.  Retail sales at the national level are up approximately 1.7% year-to-date through October. While fluctuating in the second half of 2015 and the first half of 2016, consumer confidence appeared to regain some momentum at the close of the third quarter.  The University of Michigan Index of Consumer Sentiment stood at 91.2 in September of 2016, up from 89.8 in the prior month and 87.2 in September of 2015.

Meanwhile, though entering into a mature stage of the cycle, transaction volume and new construction activity in the real estate markets continues to drive further growth and underlying market fundamentals are generally encouraging.  At the national level, the median home sale price in the for-sale residential sector increased to $240,900 in the third quarter of 2016, up 5.2% from $228,900 reported 12 months prior, as home sale activity remained relatively strong.  In the commercial sector, fundamentals across all four major property types at the national level remain healthy to improving.

Twin Cities market

Conditions in the residential and commercial real estate markets within the Twin Cities market mirror national trends.  In the Twin Cities for-sale residential market, the number of year-to-date closed home sales increased by 4.7% through October of 2016, while the median home sale price increased by 5.7% during this same period, rising from $220,000 in October of 2015 to $232,500 in October 2016.  Further indicating healthy demand, the average days on market decreased by 15.8% and the percentage of original list price received increased by 0.9% during this same period, as available inventory remains relatively limited.  The following graph presents historical median home sale prices in the Twin Cities market.

tc-median-home-sale-price

Conditions in the apartment market remain healthy, with underlying fundamentals in the Twin Cities apartment market among the strongest in the nation.  While new construction activity in the Twin Cities market remains above historical norms, demand continues to exceed the pace of new additions to existing apartment inventory, keeping vacancy rates well below the market equilibrium of 5.0% and putting upward pressure on rental rates.  Demographic trends suggest demand for apartment units will remain healthy over the long term, and a decline in the pace of new construction will put upward pressure on occupancy levels and asking rents.  Benefitting existing apartment owners and operators, new apartment construction activity may have reached a cyclical peak, as year-to-date multifamily permitting activity is down nearly 20.0% compared to the first nine months of 2015.  The following graph presents historical multifamily construction permitting activity in the Twin Cities market.

tc-multifamily-permitting

The region’s broad-based economy and employment growth continue to facilitate healthy demand within both the local for-sale residential and apartment markets.  Non-farm employment in the Twin Cities metropolitan area increased by 2.0% over the year ended in September 2016 on the net addition of 38,000 jobs.  Mirroring trends observed at the national level, growth in the Twin Cities market was strongest within the education/health services, professional/business services, and traditionally low-paying, other services sectors. These sectors combined to account for nearly 75.0% of job growth in the local market during this period.  Further employment growth in the Twin Cities market was held back by year-over-year job losses in the manufacturing, trade/transportation/utilities, and information sectors.  The following graph presents overall non-farm employment growth in the Twin Cities metropolitan area.

tc-non-farm-employment

Improvements also continue to be noted within the industrial, office, and retail sectors in the Twin Cities market.  Strong demand for industrial space exists within the Twin Cities market, and despite an uptick in new construction activity, vacancy rates within the local industrial sector remain resilient though it has caused some landlords to pause rent hikes.  Similar to trends observed at the national level, demand in the Twin Cities industrial market remains strongest for warehouse and distribution space, yet the light industrial segments also continue to record healthy absorption.  Secular trends, most notably including the rise of e-commerce, are driving much of the demand for warehouse and distribution space.  Accounting for over 8.0% of total retail sales, e-commerce is anticipated to continue rising at a robust pace, and will continue to foster strong demand for warehouse and distribution space in the local, regional, and national industrial markets into the long-term.  The following graph presents historical e-commerce retail sales as a percent of total retail sales.

e-commerce-retail-sales

Data referenced in this report was current as of November 13, 2016, and includes preliminary figures, which are subject to revision.

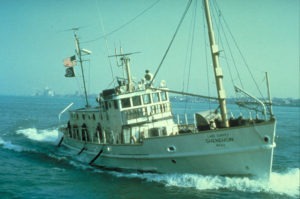
Shenehon Vessel on Lake Superior – Is There a Connection to Shenehon Company?

Some of our clients have reported seeing a 65.5-foot boat named Shenehon in Bayfield, Wisconsin on Lake Superior and wondered about the boat’s story.

RV_Shenehon_rearview.jpgThe vessel is a converted Tug-Transport (T) boat, built in 1953 by the U.S. Army.  It is now part of a fleet of vessels operated by the National Oceanic and Atmospheric Administration (NOAA) Great Lakes Environmental Research Laboratory.  The vessel was named in honor of Francis Clinton Shenehon, who was Chief Civilian Engineer of the Great Lakes Survey from 1906-1909 and was Dean of the College of Engineering at the University of Minnesota from 1909 to 1917.

rv_shenehon_t465-front-compressedTies to Shenehon Company – There is a connection between this T boat and Shenehon Company. Francis C. Shenehon was an ancestor of the late F.E. “Howard” Shenehon, who in 1929 founded a Minneapolis appraisal firm, which is now known as Shenehon Company.

Below are archive photos of the research vessel, RV Shenehon. The image on the left is from 1972 and the image on the right is from 1965.
shenehon-circa-1965 rv-shenehon-archive


Three named to Shenehon Center’s MN Real Estate Hall of Fame

Three more leaders in the Minnesota real estate industry are being added to the Minnesota Real Estate Hall of Fame, which was established by the Shenehon Center for Real Estate at the University of St. Thomas Opus College of Business.  The 2016 inductees are developer Fred Wall, broker Walter Nelson and real estate attorney Mark Westra. Hall of Fame members are selected for their outstanding business performance, high standard of ethics, and activities in the community.

Fred Wall launched his career at the Spring Co., the most prominent residential real estate company in the Twin Cities at the time, and he was quickly promoted to sales manager. From there, Wall co-founded Wall-Martin Co. and Norse Realty, and later founded WallCo.  Wall’s real estate accomplishments included owning and renovating the Foshay Tower, and partnering with Trammel Crow Co. to develop the Normandale Office Park in Bloomington. His community involvement includes supporting the United Way and the University of Minnesota Landscape Arboretum, plus leading community outreach through the Fred and Alice Wall Family Foundation.

Walter Nelson’s career spanned 56 years at the Eberhardt Co., a Minneapolis real estate advisory firm. He joined the firm in 1939 and purchased the company in 1951 after Alex Eberhardt’s death, serving as president until 1976.  Nelson remained chairman of the board until 1995.  His contributions to the community include volunteer leadership positions:  director of the Minneapolis YMCA and president of the Minneapolis Downtown Council.  Nelson was president of the Mortgage Bankers Association of America in 1959 and received the Association’s Distinguished Service Award. He has also been a director at several mortgage and real estate related companies.

Mark Westra has been a leading commercial real estate attorney in the Twin Cities since 1975.  He’s been involved in hundreds of local real estate projects and has represented some of the largest lenders, developers, owners and investors in the Twin Cities.  A longtime partner at Fabyanske, Westra, Hart and Thompson, Westra’s expertise included real estate finance, zoning, land use, and leasing.  Westra has served as an instructor at Hamline Law School and has mentored many real estate attorneys in the Twin Cities area.

Economy Market View Q2 2016

Although stock market volatility and global economic concerns highlighted the first six months of the year, the U.S. economy continued to expand through the first half of 2016.  According to the latest Beige Book, seven of twelve Federal Reserve Districts, including the Minneapolis District, reported modest to moderately increasing economic activity.  Providing an optimistic outlook, healthy consumer spending continues to support activity for nonfinancial services, and strong underlying fundamentals in the real estate sector and increasing infrastructure investment are driving construction activity.  Meanwhile, the strength of the dollar and weakness in the energy sector continue to serve as significant headwinds for manufacturers, though the outlook in the manufacturing sector improved in the second quarter.

Weakness in the energy sector and a strong dollar are serving as a drag for manufacturers at the national, regional, and local levels.  After slipping into a technical recession in November of 2015, positive indications in the manufacturing sector began to emerge in the first quarter of 2016 before demonstrating noticeable improvements in the second quarter of 2016.  According to the ISM Report on Business®, the PMI® was recorded at 53.2% in June of 2016, down slightly from 53.5% noted 12 months prior, but up significantly from 48.0% recorded at the close of 2015.  In comparison, economic activity in the non-manufacturing sectors expanded for the 77th consecutive month in June of 2016.  The following graph presents the five-year historical PMI® and NMI® index readings.

PMI and NMI Indices

The energy industry continues to be hamstrung by a glut of supply and tepid demand, yet heavy debt loads prevent many domestic producers from further curtailing production.  Spot prices for West Texas Intermediate and Brent crude in May of 2016 were both down over 50.0% compared to year-end 2013, putting significant pressure on exploration, drilling, and oilfield service firms.  Retail gasoline prices have fallen by nearly 30.0% during this same period, providing considerable relief to consumers and facilitating stronger margins for midstream firms.  The following graph presents retail gasoline and crude oil price performance since the close of 2013.

Energy Prices

In spite of global economic concerns and headwinds facing the energy and manufacturing sectors, improvements in the labor market, a stronger housing market, consumer confidence, and encouraging business investment, outside of the energy sector, support a cautiously optimistic economic outlook.  Further, readings from leading indicators suggest the national economy at the national, statewide, and local levels will continue to grow at modest pace through at least the immediate future.

Employment growth

Non-farm employment at the national level increased by 1.7% over the year ended in June of 2016.  Job growth in the service-producing sectors is leading increasing overall payroll figures, with the most robust gains noted within the professional/business services and education/health services sectors.  From a year-over-year perspective, payroll figures in the service-producing sectors increased by 2.0% in June, followed by the government/public sector (0.6%) and the goods-producing sectors (0.3%).  The following graph presents overall national non-farm employment growth.

US employment growth

Employment gains across nearly all major markets continue to put downward pressure on unemployment rates from coast to coast.  In turn, tighter unemployment rates and a shortage of skilled labor are putting upward pressure on wages, as many companies are facing difficulties attracting and retaining higher quality workers.  Nationally, the non-seasonally adjusted unemployment rate decreased to 5.1% in June of 2016, down 40 basis points from 5.5% recorded one year prior.  In comparison, the non-seasonally adjusted unemployment rate in the state of Minnesota stood at 3.3% in June of 2016, down 50 basis points from 3.8% recorded in the prior month and 20 basis from 3.5% in June of 2015.  From a statewide perspective, unemployment remains lowest in the Mankato and Rochester markets (2.7%), followed by the Twin Cities (3.1%) and St. Cloud (3.3%) markets.  The following graph presents non-seasonally adjusted unemployment rates at the national, regional, and local levels.

Unemployment MN cities

Non-farm employment in the Twin Cities metropolitan area increased by 1.5% over the year ended in May of 2016 on the net addition of 28,400 jobs.  Mirroring trends observed at the national level, growth in the Twin Cities market was strongest within the education/health services and leisure/hospitality (2.5%) sectors, which combined to add 15,000 jobs.  The following graph presents overall non-farm employment growth in the Twin Cities metropolitan area.

TC employment growth

Confidence among business owners and investment activity suggest the Minnesota economy will continue to expand at least through the near term, likely outperforming trends observed at the national and regional levels.  According to a recent survey conducted by the Minnesota Department of Employment and Economic Development, a majority of business service firms anticipate growth in sales and profits in 2017.  Moreover, the employment outlook among business service firms remains encouraging, with 92.0% of respondents expecting stable or improving employment conditions.

Planned Minnesota Expansions

Private and public investment activity within the state of Minnesota also provides an optimistic outlook.  Kraft Heinz announced plans for a $100 million investment in the company’s production facility in New Ulm, which will add four new production lines and 50 new jobs at the facility by the close of 2017.  Cliffs Natural Resources announced plans to invest $65 million over the next two years and restart options at the United Taconite mine and pellet plant on the Iron Range in August.  In addition, executives at Mayo Clinic announced in June they are seeking to find a developer to help build out more than 1 million square feet of clinic-owned land within the Discovery Square district as part of the Destination Medical Center.

Real Estate Markets Remain Strong

Residential and commercial real estate markets throughout Minnesota also remain strong.  Most notably, the for-sale residential sector in the Twin Cities market has demonstrated impressive growth through the first six months of 2016.  The number of year-to-date closed home sales in the Twin Cities market increased by 6.2% through May of 2016, while the median home sale price increased by 5.6%, rising from $214,000 in May of 2015 to $225,900 in May of 2016.  Further indicating healthy demand, the average days on market decreased by 16.5% and the percentage of original list price received increased by 1.1% during this same period, as available inventory remains relatively limited.  Activity in the for-sale residential sector also appears to have spurred a more bullish outlook from homebuilders, as permitting activity in the state of Minnesota is up over 18.0% year-to-date through May.

Despite stronger competition from the for-sale residential sector, conditions in the apartment market remain healthy, with underlying fundamentals in the Twin Cities apartment market remaining among the strongest in the nation.  Benefitting existing apartment owners and operators, new apartment construction activity may have reached a cyclical peak, as year-to-date multifamily permitting activity is down over 45.0% compared to the first five months of 2015 and down nearly 55.0% compared to the first five months of 2014.  Demographic trends are in place to suggest demand for apartment units will remain healthy over the long term, and a decline in the pace of new construction will put upward pressure on occupancy levels and asking rents.  Further, benefitting apartment owners has been the run-up in housing prices in the local Twin Cities market.  The following graph presents median home sale price trends in the Twin Cities metropolitan area.

TC median homes sales price

Although there has been a great deal of discussion on the pace of apartment rent growth in recent years, the median home sale price in the Twin Cities market has quietly increased by an average of approximately 9.25% annually over the last five years, rising from $145,000 in May of 2011 to $225,900 in May of 2016.  Rising home sale prices and a scarcity of desirable for-sale inventory will continue to keep some potential homeowners in the renter pool.  On the investment side, capital in the apartment market is becoming more selective and disciplined, but strong interest from apartment investors has been observed for 1970s and 1980s vintage value-add deals through first six months of 2016. This trend which appears to be in the early innings as construction costs continue to climb at a relatively steep trajectory and investors continue to see healthy returns on investment in value-add deals.

Commercial Real Estate Sector

Improvements also continue to be noted within the commercial real estate sectors in the Twin Cities market.  Vacancy rates in the retail sector continue to tighten, putting significant upward pressure on rents.  Although an overall net gain for the local market, rising asking rents for retail space have held back demand to some extent, as the swift pace of rent growth is beginning to price-out some retailers from entering or expanding in the Twin Cities market.  Investment activity in the retail market continues to remain strong for single-tenant net lease properties, particularly for newly-built drug store and quick service restaurant assets, while grocery-anchored shopping centers also remain in favor among investors.

In the local office market, healthy absorption continues to support improving underlying fundamentals.  Significant improvements in market fundamentals have been noted within the St. Paul Central Business District (CBD) in the most recent quarters, as the core of St. Paul emerges as a live/work/play destination and office-to-apartment conversions continue to remove space from the existing inventory.  Two big question marks for the office market, however, are lingering.  The first question is whether organic demand will remain strong enough to absorb the existing space vacated by tenants shuffling into newly built office product.  Second is the degree to which Financial Accounting Standards 13 (FAS 13) will impact the office market.  Although the goal of FAS 13 is to create greater transparency for stakeholders, the response from the market to this newly available information will dictate the degree of impact.

Data referenced in this report was current as of July 8, 2016, and includes preliminary figures, which are subject to revision.


John Schmick articles noted in Spring 2016 issue of Appraisal Journal, called “important”

Several articles by Shenehon Company appraiser John Schmick were identified in the Spring 2016 issue of the Appraisal Journal as important resources for appraisers. The Journal is the official publication of the Appraisal Institute and is the industry’s leading publication.

DSC_5925An article by Schmick and Jeffrey K. Jones published in the Fall 2014 Appraisal Journal was called “one of the very important articles for appraisers involved in corridor valuations.” This article was titled, “Is Across the Fence Methodology Consistent with Professional Standards?”

Four articles by Schmick that have appeared in Right of Way magazine are also listed as “Noteworthy Corridor Valuation-Related Articles.”

Schmick’s expertise in corridor valuation was included in Resource Center, an Appraisal Journal column by Dan L. Swango, PhD, MAI, SRA.  Swango is one of the most well-respected valuation experts in the United States.

You can see Schmick’s extensive list of published articles and access the articles by visiting his online bio at www.shenehon.com/john-t-schmick/.

Congratulations John on being recognized in Appraisal Journal!

External Obsolescence Issues in Guardian Energy, LLC vs. County of Waseca (Heard in State of Minnesota Supreme Court)

By William C. Herber and Laura A. Wisneski

External obsolescence is a type of depreciation that results from external influences, and often reduces the value of a property.  For example, if a landfill is constructed next to a home, the value of the home will likely fall, through no fault of its own and regardless of the condition of the home itself.

Several years ago, Guardian Energy (Guardian) contested the property tax value assessed to their property in Waseca County, Minnesota.  Guardian Energy operates an ethanol plant on 140 acres in Janesville, and felt the County Assessor’s values for the property in 2009, 2010, and 2011, were too high.  After their grievances were heard by the Tax Court, an appeal was made to the Minnesota Supreme Court.  The case was eventually heard in 2015 by the Minnesota Supreme Court, which focused on two issues: 1) whether the determination that the ethanol tanks on the property were real property, and 2) the tax court’s independent determination of external obsolescence.  For this article, we will only focus on the application of external obsolescence.

ethanol plant reduced

Both sides presented the court with their determination of external obsolescence for the property.  Guardian proposed a 33.3 percent reduction for each year, based on the 40% decline in commercial market values generally, and an industry-wide decrease in the profit margin of ethanol resulting from overcapacity, lower demand, and the increased price of corn.  Upon further examination, however, Guardian admitted that its profit margins were higher than industry averages.  The court also took issue with Guardian’s reliance on the price per gallon of ethanol as an indicator of the decline in value of the property, stating that the price is related to the value of the business rather than the value of the property.  The tax court cited a previous case where it was determined that “a failure to meet sales projections, does not, by itself, demonstrate that a property suffers from external obsolescence.1

Guardian’s property, however, was not a run-of-the-mill office building, where any number of businesses could operate.  An ethanol plant is a special-purpose property, and the County, while estimating slightly different reduction percentages, agreed with Guardian’s methods in this respect by also considering the price per gallon and general industry trends in its calculations.   The county concluded 45 percent, 35 percent, and 25 percent reductions for external obsolescence for each year, while Guardian Energy used 33 percent for all three years.

Rather than relying on the testimony of either side, the tax court used an entirely different approach to calculate its own determination of external obsolescence.  By taking national levels of demand and comparing these to levels of production, the tax court determined the property’s function obsolescence reduction at 16 percent, 8 percent, and 0 percent.  While the tax court would have been within its rights to reject the methods used by both sides, if it deemed them inappropriate, it would still be required to explain why it used the method it ended up choosing.  The Supreme Court decided that the tax court failed to adequately explain its reasoning for selecting this particular method of determining external obsolescence and failed to show that the method it selected is an accepted approach.

The Supreme Court could also not understand how the property value could be separated from the value of the viability of the business, because as stated previously, this was a special-use property that could only have one practical use, and “capitalization of the income loss attributable to the negative market influences is a generally respected approach to calculating external obsolescence.”  The Supreme Court acknowledged the complexity involved in determining the value of property and would not provide an opinion of which method(s) should apply, but instead recommended the case be remanded to the tax court for further proceedings.

Shenehon Company supplied the appraisal report for Guardian Energy.

1 State of Minnesota in Supreme Court A14-1883, A14-2168

The Condition of Business and Real Estate Asset Values

By Robert J. Strachota, MAI, MCBA, CRE®

Note:  The following article is a presentation given by Shenehon President Robert Strachota at the Minneapolis Business Law Institute on May 2, 2016.

I am Bob Strachota, president of Shenehon Company, which appraises businesses and commercial real estate throughout Minnesota and more than 40 other states.  We know the pulse of the Minnesota business climate and are in tune with market expectations of the near future.

Today, we will discuss the condition of the Minnesota business climate for commercial and residential real estate, and the general level of profitability for small and large businesses in our state.

The Minnesota business climate has two major tiers:  the 16-county Twin Cities metropolitan area, and the outstate Minnesota market. Rochester is an exception:  an outstate city that behaves differently than all other outstate cities because of the effect of the Mayo Clinic. Nonetheless, we will keep Rochester in the outstate category because it is not nearly as strong as the 16-county metro area.

The general health of the Twin Cities market is positive, and the prognosis is for a continued upward trend.  The healthy growth curve has not reached the crest of the wave or the high point of a business cycle.  The same applies for the outstate market, but the size of the wave is much smaller.

How do we know this? We typically focus on 6 critical community characteristics when sizing up the economic health of a market. They are:

  • Unemployment rate
  • Average wage level
  • Average age of population
  • Population growth
  • Employer and labor force data (new jobs)
  • Education level of workforce

Characteristics gauging economic health in Twin Cities 16-county area:

  • Unemployment rate: 3.9%
  • Average wage level: $20.75/hour
  • Average age of population: 36.0
  • Population growth: 4.3% from 2010 to 2015
  • Employer and labor force data (new jobs): 1.8%
  • Education level of workforce: 24.2% with Bachelor’s degree

Characteristics gauging economic health in outstate Minnesota:

  • Unemployment: 6.1% (up two-tenths over last year)
  • Average wage level: $17.35/hour
  • Average age of population: 41.8
  • Population growth: 0.7% from 2010 to 2015
  • Employer and labor force data (new jobs): 0.4%
  • Education level of workforce: 14.5% with Bachelor’s degree

Comparing the 16-county metro area and the outstate statistics with statistics for the United States at large underscores the strength of the Minnesota market.

16 counties-outstate-US

By analyzing data like this, we conclude that the Minnesota economy remains in an ongoing expansion, particularly in the 16-county metro area.  As this recovery matures, inflation, high interest rates, and cost-push will tamp down the expansion.  The risk of a Minnesota recession in the near term is low, and it does not appear that the recovery will be ending anytime soon.

Why?  Well, for one, the Minnesota economy is highly diversified. This is one of its strengths.  Of the various market sectors, the energy industry was the only one that was a strong component of the recovery but has now sharply corrected. A handful of Minnesota companies took it on the chin when oil prices plummeted.  The energy industry appears to be refreshing itself in recent weeks and may have already bottomed out.

Currently, there are no storm clouds on the horizon for the Minnesota economy. These would appear if the economy showed evidence of “excesses” by consumers or businesses. On the consumer side, there is little evidence of excessive spending and, in fact, the household savings rate has risen to near record levels in Minnesota.  Furthermore, household net worth is approaching record levels.  As a result, household debt service ratios are near record lows.

As for businesses, we do not see the kinds of excesses that typically reveal themselves ahead of a recession. Instead, we observe that most businesses are not overstaffed, and their capital spending has not been overdone.  Average factory utilization rates have not exceeded 80%.  The housing industry has not boomed out of control, and consumer confidence has been timid.  And, lastly, excessive lending and overbuying is not evident in the marketplace.

Growth image

Business has been good for most Minnesota companies. For 2015, the top 75 public companies operating in the state reported a combined increase of profit of over 5% from the previous year. This includes the energy-related companies that lost over $2 billion.  The total revenue for these 75 companies was over $512 billion, which tops every year since 2004.  Fifty of the companies on the list posted higher revenues than they did in 2014.

IRS and Medtronic

These are impressive results, but there is one statistic that we need to be aware of. The list we could previously study was called the Top 100 Public Companies.  A major reason for the list shrinking is that fewer companies are choosing to be headquartered in Minnesota. The trend is downward, but diagnosing the severity of the problem is difficult.

At Shenehon, we also appraise many private companies. This gives us access to financial information that is not public.  Right now, the patterns of success we have just reviewed for public companies are mirrored in the private sector.

For small businesses specifically, we conduct valuations for federal government Small Business Administration (SBA) loans, and we can report that small businesses are opening up at record levels, creating new jobs and becoming profitable on timely schedules.

So how does the current state of the Minnesota economy affect real estate asset values? Let’s study this by submarkets, which are residential, retail, office and industrial.

RESIDENTIAL

residential sales

The residential submarket has to be subdivided further into single-family homes and apartment rental housing.  The single-family home market in the 16-county metro area has been strong and will continue to get stronger.  Short sales and foreclosures no longer dominate the market and have fallen back to historical norms.

homes prices

The traditional home sale transaction dominates the market; both in the metro area as well as most outstate markets.  Average home prices throughout Minneapolis rose 3.98% in February 2016, compared to a national average increase of 5.1%.

Building activity

New housing starts are steady and nearly fully restored to historical levels.  The top cities in the metro area for new housing permits are shown in this next exhibit, with Lakeville leading in dollar value of permitted units, and Minneapolis leading in number of housing units.

Top cities for building

projects under construction

The apartment market is expanding at a record pace, with apartment projects planned throughout the metro area.  Outstate, we have over 1,000 new units planned in Rochester, coinciding with the Mayo expansion, and Duluth is way up as well – five developers have announced plans for a total of 577 new units planned for next year.

RENTS AND VACANCIES

Rents continue to rise, and vacancies have shrunk to abnormally low levels.  Exhibit H shows average rents and vacancy levels in various areas in the 16-county metro area and certain outstate markets.

Twin Cities Apartments

Outstate Apartment market

There are two reasons why the rental market is so strong. First, many people lost money in the housing downturn and have chosen a different lifestyle while in recovery.  Second, most young people are saddled with substantial educational debt that precludes them from buying homes, either single-family or condominiums.  Many of us in the real estate industry believe the educational debt crisis will be the next financial debacle that the federal government will need to fix to return normality to the single-family home ownership market.

Student debt

RETAIL

Bolstered by a relatively modest rate of increasing personal income levels and lower fuel prices, demand in the national retail market outpaced supply during all of 2015.  Demand for available retail space in the neighborhood community segment was particularly strong during the year.

The average vacancy rate in the national retail market trended downward another 20 basis points in 2015, declining to the low 10% range.  The national average net asking rates increased 2% during 2015.

The first quarter of 2016 marked the fifth consecutive quarter of positive net absorption in the Twin Cities market.  Across all Twin Cities submarkets the 1st quarter vacancy rate sits at a mere 6.0% and average net asking rental rates are $15.66/sf.

The Minneapolis/St. Paul market experienced a moderate decline in asking rents during the first quarter of 2016.  However, due to the number of new retailers and new restaurants entering the market, demand is expected to cause rents to increase in most submarkets.  Market value of retail space has remained constant over the past year, but has now surpassed the all-time highs from before the real estate recession.

Let’s move onto the office market.

OFFICE

Overall the office market has been affected by somewhat slower job growth, increased financial market volatility, and a marked slowdown in the tech sector.  These influences contributed to a deceleration in the demand for office space in the first quarter of 2016.  During that time, the average rent in 87 metro markets in the US was $28.50/sf.  That was up 4.3% from the prior year.

Overall, vacancy throughout the United States is 13.5% in the office sector.  Current vacancy in the Twin Cities market is slightly higher at 15.1%, however that is down 1% overall from last year at the same time.  It is important to note that the vacancy for office space in the new, north warehouse loop is 6.4%, that is less than half of the national vacancy percentage and it is the tightest office market in our metro area.

In the Twin Cities, the average rent is $21.82/sf in the first quarter of 2016, which is up from $20.63/sf for a 5.8% increase from the prior year.  Office values in the Central Business District, or CBD, are the strongest and have experienced an increase over the past year.  The suburban office market in the Twin Cities as well as other cities has remained rather static throughout the past year.

INDUSTRIAL

Our fourth submarket is Industrial.

The manufacturing sector has improved in the first quarter of 2016.  US factory activity expanded in March for the first time since last August.  This is a sign that the nation’s economy is shaking off the effects of a strong dollar, depressed oil prices, and weak global growth.  Current production has picked up, with factory orders rising to their highest level since November of 2014.  All signs suggest there is a pickup in industrial production, yet businesses continue to work through the elevated stockpiles accumulated over the first half of 2015, when record inventories outpaced demand.

There has been progress because inventories have declined in four of the past five months, with one exception being a flat reading in December.  But despite these back-to-back inventory declines, the inventory-to-sales ratio remains elevated at 1.4 percent. This suggests that businesses will need to continue to work through the inventory overhang – which is hampering manufacturing and will curb GDP growth through the first half of 2016.

The average asking rent on a national basis in the first quarter of 2016 was $5.44/sf, which is 3.8% higher than the first quarter of 2015.  The United States national average of vacancy for industrial space is 6.1%, which is down from the historical average rate of 6.8% in the first quarter of 2015.

In the Twin Cities market, the overall vacancy for industrial space at the end of the first quarter of 2016 was 9.4% compared to 10.6% one year ago.  The weighted average rent per square foot for industrial space in the Twin Cities market at the end of the first quarter of 2016 was $6.72/sf, which was up 6% from 2015 when it was $6.32/sf.  At the end of the first quarter of 2016, approximately 900,000 square feet of positive absorption occurred in our industrial market.  Over the last five quarters, the industrial market has absorbed 4.4 million square feet of space.

This is a lot of data to crunch… suffice it to say that in my professional opinion, we can conclude from these numbers that, in the Twin Cities area, the industrial market is healthy and will likely only get stronger.

During 2016, we expect to see an increase in market values or pricing of industrial space that will set new high water marks for industrial property.

Another proof point for this expectation is that the average price per square foot on a national basis increased 9.5% in 2015, which reaffirms the strength of the industrial market.

LIST OF REAL ESTATE DEVELOPMENT and BORROWING OPPORTUNITIES FOR 2016

I would like to wind down by sharing a brief listing of real estate and development opportunities for 2016.

Investment opportunities in gateway markets like the Bakken fields have come and gone. However, opportunities now exist in:

  • Technology Centers. Companies are collaborating on larger facilities with enhanced security to safeguard data and confidential records.
  • Neighborhood development. There is some small neighborhood development available for retail, such as coffee shops, small stores, and specialty services. Anything that starts with an “R” is a safe bet – renovation, rehabilitation, re-position, re-lease, refinance.
  • Residential condominium development. Opportunities exist in spot markets, such as downtown Minneapolis, where there is an acute shortage of “for sale” condominiums. But a 10-year clawback by homeowners is a deterrent.
  • Most Mixed-use urban infill development and redevelopment will be strong, if strategically located.
  • Prime retirement land. Development opportunities will be back as demand for retirement homes in warm places like Florida and Arizona reignites.

BORROWING OPPORTUNITIES FOR 2016

  • Last opportunities to lock down favorable long-term, fixed rate debt. Commercial mortgage-backed securities (CMBS) are back, the competition in the lending market is strong and interest rates are below long-term norms. Some owners are refinancing and leveraging up with cheap debt – in a sense, selling to themselves without paying income taxes by using non-recourse debt. But the interest rates are rising and the time is limited to lock down favorable long-term debt.
  • Bargains in Downtown Minneapolis leasing. As Wells Fargo moves to new offices, look for bargain pricing on Class B office lease and subleases in the core of downtown Minneapolis.

 MARKET PRICING FOR 2016

Before I close today’s presentation, I want to make a few cautionary comments about market pricing for 2016.

Market pricing is strong across all submarkets; bargains can still be found in large, high-end luxury housing.  There is a strong risk of overpricing in apartment buildings, while hotels are not far behind.  The expectation of low capitalization rates, i.e. sub-6%, is not sustainable.  Corporate balance sheets are strong and earnings are holding, but for foreign exchange issues for multi-nationals.  Unemployment is tightening, but wage growth will be slow because the US competes in a world market of lower wage levels.

MINNESOTA’S ECONOMY HIGHLIGHTS

Closer to home, here are the takeaways for Minnesota’s economy:

  • Our state’s economy is growing ahead of national trends in the 16-county metropolitan area, and ever so slowly in the outstate areas.
  • Minnesotans are back to work and consumer spending will continue to improve, due to increased “housing wealth,” a recovery stock market, and confidence from de-leveraging.
  • Minnesota businesses will postpone spending and hiring decisions because of a lack of confidence in our current politicians and their strategies for government spending in the future.
  • The Minnesota economy will continue to recover, but it will not boom until the federal government restores confidence in the marketplace on key factors such as employment, inflation and bipartisan cooperation on balanced budgets and deficit reduction policies.

And thanks to each of you for the opportunity to share my thoughts on Minnesota’s business climate for commercial and residential real estate, and the general level of profitability for small and large businesses in our state.

Sources for this article:  Standards & Poor/Case-Schiller, U.S. Census Bureau, Bureau of Labor Statistics, Jones Lang LaSalle, CBRE, Colliers International, Metropolitan Council, The Builders Association of the Twin Cities, Duluth News Tribune, City of Rochester Comprehensive Annual Financial Report, Northstar/MLS, NAI Everest, MPF Research, Zillow

Industrial Market – 2015 Recap

Demand

Posting positive demand for the 23rd consecutive quarter in the fourth quarter of 2015, absorption in the national industrial market totaled nearly 220 million square feet during the year, with the pace of absorption increasing across most major markets.  Several trends and factors are supporting strong demand in the industrial sector.

Most notably, e-commerce sale activity continues to increase at an impressive rate and companies are responding to consumer preferences by shortening the supply chain to deliver goods more quickly.  Additionally, a number of coastal markets are also benefitting from the anticipated opening of the Panama Canal expansion.  Given the changing landscape, demand in the industrial sector is projected to be healthy through at least the near and into the long term, and to a significant degree, a sizeable amount of absorption in the industrial sector will come at the expense of the retail sector.

Absorption in the industrial sector during the year was led by the logistics segments, though positive demand was also noted in the light industrial segments.  Demand remains robust throughout all regions.  The strongest absorption figures continue to be noted for logistics space in primary industrial markets, including the Atlanta, Chicago, Dallas-Ft. Worth, and Inland Empire markets.  Absorption in the Midwest region is led by the Chicago market, followed by the Indianapolis, Detroit, and Twin Cities markets.

Led by demand for warehouse and distribution space, absorption in the Twin Cities industrial market totaled approximately 3.55 million square feet in 2015.  The light industrial segment in the local market also was consistently healthy during the year.

New Construction

Led by growth in the logistics segment, new construction activity in the industrial sector increased at a rapid pace in 2015, with the amount of new distribution space added during the year particularly impressive.  New construction deliveries involving logistics space, including both distribution and warehouse properties, increased by 2.5% over the year ended December 2015, while new construction in the light industrial segment increased by 0.2% during this period.  Accounting for a significant portion of the sectors pipeline, speculative construction activity in the industrial sector has surpassed pre-recession levels, with sources indicating as much as 40.0% to 60.0% of new logistics properties under construction are being built as speculative projects.

Among regions, new construction activity is strongest in the West and South regions, but construction levels were also strong in the Midwest and Northeast regions.  Over 20 million square feet of new inventory was delivered in the Inland Empire market during the year, while new construction added over 15 million square feet of space in both the and Chicago and Dallas-Ft. Worth markets.  Despite widespread industrial construction activity in the Inland Empire market, the market’s vacancy rate decreased into the low-3.0% range at the close of 2015, down 80 basis points compared to the fourth quarter of 2014.  In the Northeast region, developers continue to remain active in the Lehigh Valley market, with Liberty Property Trust construction a 1.7 million-square-foot distribution building for Uline and Duke Realty scheduled to deliver a 1.1 million-square-foot speculative building in 2016.

Development activity in the Midwest region was led by the Chicago market, but supported by widespread new construction in the Indianapolis, Kansas City, and Twin Cities markets.  Although the pace of new construction activity in the Indianapolis market appears to be slowing, developers added nearly 6.5 million square feet of speculative space to the market over the last 18 months, adversely affecting occupancy levels in the face of healthy absorption figures.  Developers added roughly 1.77 million square feet to the existing Twin Cities inventory in 2015.  Development activity in the Twin Cities was strongest in the Southwest submarket, but developers are active throughout much of the area.

Vacancy

In the face of robust new construction activity, vacancies in the national industrial sector decreased by 40 basis points in 2015, declining into the mid-7.0% range at the close of the year.  Vacancy rates in over 20 major markets have fallen below 6.0%, and on the national level, vacancy rates have declined by approximately 3.5% in the last five years.  Occupancy levels in the light industrial segment noted the most significant improvement in 2015, but vacancy rates continue to remain tighter in the logistics segment, in spite of new development activity.

Occupancy levels further increased within most major markets.  Vacancy rates remain tightest in the West region, but softer occupancy levels were noted within some markets in the region compared to the year prior.  Occupancy levels in industrial markets throughout the Midwest largely remain strong, but a surge in speculative development is testing demand in several Midwestern markets.  Vacancy rates in the Twin Cities market declined by a sizeable amount in 2015, and though excess capacity exists, noticeable improvements in occupancy levels were recorded in the Southwest submarket.

Asking Rent

Over 50.0% of major markets recorded year-over-year asking rent growth of greater than 3.0% in 2015, as rents increased at a robust pace in both the logistics and light industrial segments.  Strong rent growth was noted across several Midwestern markets, and asking rents advanced across all submarkets in the Twin Cities industrial market, but the strongest growth was observed in the Southwest submarket.

Investment Activity

The industrial sector has emerged as a preferred asset type for institutional and foreign investors.  Favorable investment returns and minimal capital expenditures compared to other asset types as well as the emergence of e-commerce have attracted investors to enter and expand their reach into the industrial market.  Sales activity in the national industrial market increased by 44.0% year-over-year in 2015, with sales volume totaling nearly $72 billion for the year.  Sales activity in the industrial market began the year at a robust pace, before reaching a lull in the second and third quarters of 2015, and then finished strong in the final three months of the year.  Sales volume in the light industrial segment increased by approximately 30.0% year-over-year in 2015, but activity in the light industrial segment remains overshadowed by investment in logistics space.

Industrial assets have become a favored property type among foreign and institutional buyers, resulting in stronger pricing and capitalization rate compression.  The average sale price on a per square foot basis in the national industrial market increased by 9.5% year-over-year in 2015, while average capitalization rates in the sector decreased by 40 basis points during the year.  Prices increased in both segments of the industrial market, with the average price per square foot in logistics approaching $70 per square foot and surpassing the $80 per square foot in the light industrial segment.  Capitalization rates in both the logistics and light industrial segments compressed at a similar rate during the year, and private investors in the industrial sector remain aggressive in underwriting rents and vacancy.

Some concern in the national industrial market, and in the broader commercial real estate market, is the greater amount of portfolio and entity-level transactions.  Three massive sales accounted for over 20.0% of all industrial sales volume in 2015.  Exeter Property Group sold a 57.9 million-square-foot industrial portfolio for $3.15 billion in December of 2015.  Earlier in the year, Global Logistic Properties and Singapore’s sovereign wealth fund completed an $8.1 billion purchase of IndCor Properties industrial assets and operating company from Blackstone, while Prologis and Norges Bank Investment Management purchased a portfolio from KTR for $5.9 billion.  The KTR portfolio contained 60 million square feet of operating space, 3.6 million square feet of space under construction, and a land bank with a build-out potential of 6.7 million square feet.

A number of large single-property sales also occurred during the year, with a significant amount of activity noted in the Midwest region.  Two of the largest single-property transactions at the national level in 2015 involved Duke Realty selling a mission-critical building leased by Amazon in Delaware for $91 million, equating to approximately $89.50 per square foot, and the sale of a newly-built Home Depot Fulfillment Center in Ohio for $97 million or $59.20 per square foot.

Mirroring trends at the national and regional levels, industrial investment activity in the Twin Cities was strong in 2015.  Several large portfolios in the Twin Cities market were sold during the year, but sales velocity drove sales volume in the local market and investment activity in the local market was consistent throughout the year, with healthy activity noted across all segments and submarkets.  One of the largest transactions in the Twin Cities market during the year included the sale of the BAE building for $46.8 million to Gramercy Property Trust in July.

Retail Market – 2015 Recap

Demand

Bolstered by a relatively modest rate of new construction activity, increasing personal income levels, and lower fuel prices, demand in the national retail market outpaced new supply in all four quarters of 2015, as positive absorption across all property subtypes facilitated improving market fundamentals.  Demand for available retail space in the neighborhood/community segment was particularly encouraging during the year.  As evidenced by healthy retail sales figures in spite of declining foot traffic and shrinking footprints among big-box retailers, the emergence of e-commerce continues to impact absorption levels in the retail market.

Absorption in the retail market also remained positive across all regions in 2015.  From a year-over-year perspective, absorption in the national retail market was strongest in the South region, with the Dallas-Fort Worth, Atlanta, Raleigh, South Florida, Austin, and Orlando markets absorbing excess capacity at the most robust rates.  Absorption was also strong in the West region, particularly in the Bay Area markets, with the Phoenix and Las Vegas markets also recording significant improvements in demand for retail space.  Although remaining positive for the year, the pace of absorption in the Northeast region appears to be slowing.

Absorption in the Midwest region continued to gather momentum during the year, but absorption figures in the Midwest region remained more modest from a national perspective.  Bolstered by competition in the grocery space for market share, the pace of absorption in the Twin Cities retail market increased during the year.  Absorption in the Twin Cities market was strongest within neighborhood centers in 2015, with the Northeast submarket logging the most robust demand.

New Construcation

Although new development in the retail sector remains modest relative to historical norms and other property types, construction activity accelerated slightly in 2015 compared to recent years, though a noticeable divergence in activity among retail segments exists.  New construction levels of power centers are considerably lower than in previous cycles, while construction activity for grocery-anchored community/neighborhood centers has regained momentum, indicating an improving outlook among smaller retailers.

Development activity also remains bifurcated by location.  In contrast to recent cycles, in which developers were chasing rooftops into outer ring suburban and exurban locations, a greater amount of new retail development is occurring in the nation’s urban core, with developers targeting infill sites in walkable and transit-oriented locations.

Among regions, new retail construction activity is strongest in the South region, followed closely by the Northeast and West regions.  The amount of new inventory added in the Orlando retail market doubled in 2015 compared to the year prior, with the pace of new construction expected to further increase in 2016.

New retail development remains relatively muted in the Midwest region, but was supported by healthy activity across a number of markets in 2015, including the Kansas City, Detroit, and Indianapolis markets.  Retail construction levels remain consistent in the Twin Cities market, and mirroring trends observed at the national and regional levels, a majority of new construction in the local market consists of grocery and grocery-anchored neighborhood space.  In contrast to trends observed at the broader levels, however, retail development activity in the Twin Cities market remains healthy in outer ring suburbs, including Woodbury and Plymouth.

Vacancy

Aided by modest new construction activity, the average vacancy rate in the national retail market trended downward by another 20 basis points in 2015, declining into the low-10.0% range at the close of the year.  Occupancy levels within the retail sector continue to be highly bifurcated by location, with properties in strong locations within good trade areas thriving and properties in weaker trade areas struggling to regain momentum.

Retail occupancy levels are highest within the West and Northeast regions, though several markets in the South region demonstrated the most substantial improvements in occupancy levels compared to the prior year.  In spite of an aggressive pace of new construction and the downturn in the energy industry, retail vacancies decreased in the four largest markets in the state of Texas.  Developers delivered nearly 4 million square feet of retail space in the Dallas-Ft. Worth market in 2015, yet occupancy in the market reached the highest levels recorded over the last 10 years.

Vacancies in the Midwest are strongest in the Columbus market, yet the biggest improvement in occupancy levels within the region was recorded in the Detroit market.  Retail vacancies declined in the Twin Cities market during the year, and despite healthy demand for neighborhood centers, occupancy levels remain strongest at regional and super regional centers.  Among submarkets in the Twin Cities area, retail vacancies are tightest in the Southwest submarket, but encouraging demand, led to the most impressive gains in occupancy levels within the Northeast submarket.

Asking Rent

After advancing by 1.0% in 2013 and 1.7% in 2014, asking rents in the national retail market increased by 2.0% over the year ended December 2015.  Led by rent growth in excess of 5.0% within the San Francisco, Orange County, Los Angeles markets, the strongest rent growth within the retail sector was noted in the West region during the year, followed closely by the South region. Rent growth within the Northeast region was relatively tame in 2015, decelerating slightly during the course of the year, while rent growth remained generally subdued in the Midwest region.  Rent growth in the Midwest region was led by the Indianapolis, Kansas City, and Milwaukee markets, with asking rents also advancing in the Twin Cities market.

Investment Activity

On a per square foot basis, property prices in the national retail sector increased by approximately 2.5% year-over-year in 2015, as capitalization rates trended downward by 30 basis points during the year, yet overall sales volume in the national retail market decreased to $82.5 billion in 2015, down 5.0% compared to the year prior.  Accounting for approximately 19.0% of all sales activity among the four major property types in 2015, sales activity in the retail sector was strong in the first quarter of 2015 and then tapered off in the remaining three quarters of the year.

Investor interest in the retail sector remains strong for single-tenant net lease assets, with particularly strong competition among buyers for available drugstore and quick-service restaurant assets.  Transactions involving net lease drugstores selling for more than $10 million totaled at least 14 in 2015.  Five of the 14 sales transactions over $10 million involved net lease drugstores that also sold for more than $1,000 per square foot.  The largest net lease drugstore sale transaction during the year involved a 16,000-square-foot Walgreens located along The Strip in Las Vegas.  Built in 2000, the property is located along Las Vegas Boulevard, just north of the Wynn and Encore and across the street from the planned World Resorts Casino.  Equating to over $2,300 per square foot, the property sold for $37 million in October 2015.

In addition to strong interest for single-tenant net lease assets, investment activity in regional and super regional malls accelerated during the course of 2015, as investors demonstrated renewed interest in obtaining large retail assets in some of the markets hit hardest by the subprime crisis.  More specifically, investment interest in larger retail assets increased within the Atlanta, Las Vegas, Phoenix, and South Florida markets.  Kimco Realty Corporation purchased the 850,000-square-foot Christown Spectrum Mall for $115.25 million in November 2015.  Additionally, a joint venture purchased the Tempe Marketplace in October 2015 for $367 million.  Located along the 202 corridor in the city of Tempe, Arizona, the Tempe Marketplace is an expansive open-air super regional mall that is situated in close proximity to the main campus of Arizona State University and Marina Heights.

Further demonstrating improvements in the regional and super regional mall segments, Taubman Centers and Macerich announced an agreement to purchase Country Club Plaza just after the close of 2015.  Located approximately four miles south of downtown Kansas City, Country Club Plaza is a 15-block, mixed-use development containing 1.3 million square feet of retail and office space. A sale transaction closed on the property later in the first quarter of 2015 for $660 million.  Additionally, MGM Resorts International has reportedly reached an agreement to sell the Shops at Crystals mall to group led by Simon Property Group for $1.13 billion.

Sales volume in the Twin Cities retail market increased by 20.0% in 2015 compared to the year prior.  One notable transaction during the year included Heitman purchasing the former Knollwood Mall in St. Louis Park for $106.7 million.  Situated along Highway 7, just east of Highway 169, the property has undergone the transformation to a grocery-anchored community shopping center.

Economy Market View – 2015 Recap

According to the latest Beige Book, seven of twelve Federal Reserve Districts, including the Minneapolis District, reported increasing economic activity.  Economic activity in four of the remaining five districts was noted as mixed or flat, with economic activity declining in the Kansas City district, due to weakness in the energy and manufacturing sectors.

Construction, business investment, and consumer spending continue to take on leadership roles in driving the domestic economy, while global economic concerns as well as conditions in the oil and gas industry and manufacturing sector continue to serve as drags on more robust growth.  Fostering growth in the construction sector, the pace of homebuilding has begun to accelerate and commercial construction activity remains strong across numerous major markets.  Business investment and consumer spending levels also remain encouraging; with conditions in the labor market continuing to tighten.

The energy industry continues to be hamstrung by a glut of supply and tepid demand, resulting in lower commodity prices.  In the state of North Dakota, the number of active drilling rigs has fallen to the lowest levels observed since 2009.  Spot prices for West Texas Intermediate and Brent crude both declined by over 30.0% in 2015, putting significant pressure on producers, with retail gasoline prices falling by roughly 26.8% providing considerable relief to consumers and supporting healthy retail sales.

Although the overall economy expanded for the 81st consecutive month in February 2016, activity in the manufacturing sector contracted for the 5th consecutive month in this period, yet nine of 18 manufacturing industries continued to report growth.  According to the latest ISM Report on Business, the manufacturing sector showed some improvement in February of 2016 compared to year-end 2015, but the Purchasing Manager’s Index (PMI) remained below the pivotal 50.0% mark.  The PMI registered 49.5% in February 2016, up from 48.0% in December of 2015, but down from 52.9% recorded in February 2015.
PMI chartA strong dollar and the downturn in the oil and gas industry are also adversely affecting conditions in the manufacturing sector, with choppy and uneven results recorded across the manufacturing sector during the year.  Manufacturers that rely on oil as an input cost have fared relatively well, while companies that provide goods to oil and gas companies have suffered.  All segments in the manufacturing sector, however, have been impacted to varying degrees by the strength of the dollar, as international export levels at several major ports have sagged.

Several other economic indicators remain mixed.  Activity in the non-manufacturing sector increased for the 73rd consecutive month in February 2016, with the Non-Manufacturing Index (NMI) standing at 53.4%, yet the most recent NMI readings have fallen below the rolling 12-month average of 56.6%.  After falling by 0.3% in December 2015, the Conference Board Leading Economic Index also slipped another 0.2% to 123.7 in January 2016.  In spite of rising concerns, most economic indicators continue to signal modest economic expansion in the months ahead.

National Employment

While representing a slight deceleration from the 2.2% increase recorded in 2014, non-farm employment at the national level increased by 2.0% year-over-year in December 2015 on the net addition of over 2.7 million jobs.  Employment growth in the service-producing sectors increased by 2.1% over the year ended in December, up from 1.9% posted 12 months prior.  The goods-producing sectors also noted improvements, but the pace of growth decelerated from 2.9% in 2014 to 1.0% in 2015.  Marking the second consecutive year of positive, albeit modest, improvements, headcounts in the public/government sector increased by 0.5% in 2015, on par with the growth recorded one-year ago.  The following chart presents non-farm employment growth at the national level.

US non-farm employment growthFacilitated by employment growth, the national non-seasonally adjusted unemployment rate decreased to 4.8% in December 2015, remaining unchanged compared to the month prior, but down 60 basis points from 5.4% recorded in December of 2014.  Tight conditions in the construction sector are creating significant upward pressure on skilled labor wages, yet wage growth remains uneven across employment sectors.

Conditions in the labor market are healthy in the majority of major markets.  Non-farm employment increased by over 3.0% annually in 18 of the largest 84 metropolitan areas during year, with 16 of the 18 markets also boasting unemployment rates below 5.0%.  The pace of job growth remains strong across a number of markets in the West region, but hiring activity continues to gain momentum in several Midwestern markets.

The following tables present the nation’s top 10 leaders and laggards in unemployment rates and employment growth.

unemployment rate

Leading non-farm employment growth in the Midwest region were the Sioux Falls and Grand Rapids metropolitan areas, which witnessed year-over-year employment growth of 4.1% and 3.8%, respectively.  Non-farm employment in the Twin Cities metropolitan area increased by 1.8% year-over-year in 2015 on the net addition of approximately 34,000 jobs.  Job growth within several of the Twin Cities largest employment sectors, including education/health services, professional/business services, and financial activities, remained particularly encouraging, though the strongest growth was within the leisure/hospitality sector during the year.

TC non-farm employment growthUnemployment rates within 68 of the largest 84 metropolitan areas were below 5.0% at the close of 2015.  Labor markets are tightest in the Midwest region, with seven of the largest metropolitan areas enjoying unemployment rates at or below 3.5%.  The non-seasonally adjusted unemployment rate in the state of Minnesota stood at 3.6% in December 2015, unchanged compared to the year prior, but up 60 basis points compared to 3.0% posted in November of 2015.  Labor markets in most Minnesota metropolitan areas remain relatively tight.  Unemployment remains lowest in the Mankato area (2.5%), followed by the Rochester (2.9%) and Twin Cities (3.1%) areas, while unemployment stands above the statewide rate in the St. Cloud (3.7%) and Duluth (5.5%) areas.

MN unemploymentFor-Sale Residential

Sales activity and prices increased by sizeable margins in the national for-sale residential market during the year.  Existing home sales activity increased by 6.3% in 2015, compared to a decline in 2014, while the pace of new single-unit home sales advanced at a more rapid rate, increasing by 14.6% in 2015.  Activity within both the single-unit and multi-unit segments also showed improvement, as renewed demand continues to build for townhome and condominium product.  In turn, the national median home sale price increased by 6.9% in 2015, rising from $208,400 to $222,700 during this period.

Among regions, pricing increases in the for-sale residential sector were led by the West region, which witnessed the region’s median home sale price increase to $323,600 at the close of 2015, up 8.4% compared to the year prior.  In the West region, the for-sale residential sector remains strong across most markets, with an aggressive pace of growth recorded in the Denver, Portland, and Seattle markets during the year.  In the Denver market, the median home sale price has increased by over 20.0% within the last 24 months.  Sale prices also are rising at a robust pace in markets hit hardest by the subprime crisis, with the median sale prices increasing by at least 9.0% in the Las Vegas, Orlando, and Phoenix markets in 2015.  Although noting significant upward pressure in 2015, for-sale residential product remains a relative bargain in the Midwest region, with a median home sale price standing at $171,600 in the fourth quarter of 2015, nearly 20.0% below the national average.

Progress continues to be noted within the for-sale residential sector in the Twin Cities market.  Increasing from approximately 49,600 in 2014 to 56,390 in 2015, the number of closed home sale transactions in the Twin Cities market increased by 13.7% over the year ended December 2015.  Indicating healthy demand, the average days on market decreased by 2.6% and the percentage of original list price received increased by 1.0% during this same period.  Due to stronger competition among buyers, the median home sale price in the Twin Cities metropolitan area increased by 7.0% over the year ended December 2015, increasing to $220,000 at the close of the year.

Construction

Employment growth and progress in the for-sale residential sector have supported a more optimistic outlook from homebuilders, and confidence among homebuilders rose to the highest levels in more than a decade in 2015.  The National Association of Home Builders/Wells Fargo Housing Market Index increased to 60 in June 2015 and remained at or above that level through the close of 2015.

Both commercial and residential construction activity remains strong in the Twin Cities market.  In the city of Minneapolis alone, construction permits were issued for development projects valued at nearly $1.4 billion in 2015, marking the fourth consecutive year of over $1.0 billion in permitting activity.  Construction is scheduled for completion on the new Vikings Stadium and massive Downtown East project in 2016, yet a number of significant development projects remain in various stages of the construction pipeline throughout the region that will support healthy activity into at least the intermediate term.

Apartment Market

Facilitated by healthy employment growth and favorable demographic trends, the apartment market continues to remain strong at the national, regional, and local levels, in spite of a wider new construction pipeline.  Asking rents at the national level continued on an upward trend in 2015, marking the 6th consecutive year of asking rent growth in excess of 2.5%, while vacancy rates in the national apartment market remained essentially unchanged.  Conditions in the Midwest regional and Twin Cities apartment markets closely mirrored trends observed at the national level, as underlying fundamentals and investment activity remain strong.

Sales volume in for 50+ unit apartment properties in the Twin Cities market increased by approximately 6.4% over the year ended in December 2015, reaching nearly $900 million during the year.  Apartment pricing in the Twin Cities market also continued on an upward trend during the year, and the average price per unit in the Twin Cities market increased by 32.0%, rising from $112,850 in 2014 to nearly $150,000 in 2015.  Upward pressure on pricing in the Twin Cities market has been supported by a greater composition of sales activity involving newly built Class ‘A’ properties in the region’s core.

TC 50+ unit sales activity

Notable transactions in the Twin Cities market during the year involved several Class A buildings in the core of Minneapolis, including 222 Hennepin, The Paxon, and The Walkway.  These three transactions combined to account for approximately 22.0% of sales volume involving 50+ unit properties in the Twin Cities market in 2015.  Several large suburban apartment assets also traded in 2015.  Valley Creek Apartments, a 402-unit apartment property in Woodbury, sold as a value-add property for $54.25 million in May of 2015, after selling for $33 million five year prior.  Sales activity involving small- and mid-size properties also remained healthy through 2015.

CRE Market

Fundamentals across the industrial, office, and retail sectors also continue to demonstrate improvement, with the most robust growth recorded within the industrial sector.  Led by demand for logistics space, market conditions in the industrial sector at the national, regional, and local levels continued to improve in 2015, with strong absorption figures driving vacancy rates lower and putting upward pressure on asking rents.  Absorption in the office sector has been supported by a more intense pace of employment growth within the traditional office-using employment sectors.  Vacancy rates in office sector continue to trend downward, putting upward pressure on asking rents.  In spite of the rise in e-commerce and the pursuit of smaller footprints by retailers, the retail sector also noted positive absorption in 2015.  Combined with a more restrained pace of new development activity, demand for retail space facilitated improvements in occupancy levels and asking rents.

Fueled by improving to strong underlying fundamentals, the availability of low interest rate financing, and attractive yields relative to alternative investments, investment activity in the commercial real estate market remained strong in 2015.  Sales volume for property and portfolio sales of more than $2.5 million increased for the 6th consecutive year in 2015, with sales volume increasing on a year-over-year basis in three of the four major property types.  The strongest year-over-year growth in sales volume was recorded within the industrial sector, yet overall sales volume continued to be led by the apartment and office sectors.  The following chart presents national sales volume in the four major property types for property and portfolio sales of greater than $2.5 million.

CRE investment activityFor additional details on the performance of the national, regional, and local commercial real estate markets, please see our 2015 property sectors recaps at www.shenehon.com

Data referenced in this report was current as of March 7, 2016, and includes preliminary employment numbers as reported by the Bureau of Labor Statistics, which are subject to revision.