Economic and Real Estate Market Snapshot
Article Highlights:
• National economic activity on the upswing
• Homebuilding, business investment and consumer spending drive economic growth
• Housing Market Index increased to highest level since October 2005
• Non-farm employment increased by approximately 513,000 jobs
• Unemployment is under 5% in 49 of the 82 largest metropolitan areas
• Manufacturing production growth is uneven among industries
• Capital markets – when will the Fed raise rates?
• Homeownership rate falls to lowest level in 50 years
National landscape – economic activity on the upswing
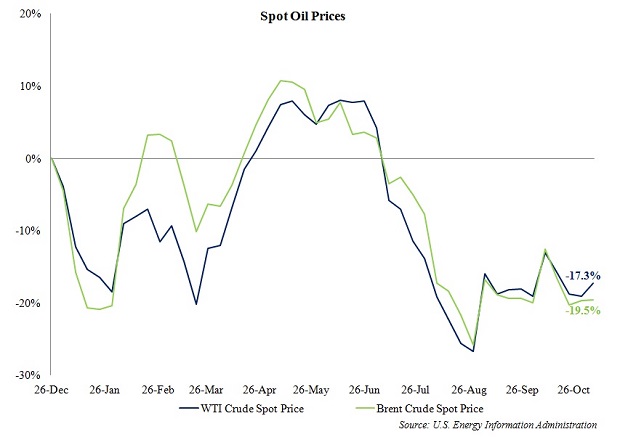
According to the latest Federal Reserve Beige Book, eleven of twelve Federal Reserve Districts, including the Minneapolis District, reported increasing economic activity. Largely due to weakness in the energy sector and a stronger dollar, the Kansas City District reported a slight decline in activity. After a brief pause, the dollar rally resumed in earnest following the close of the third quarter, and upward pressure on oil prices observed in the second quarter dissipated, with WTI Crude and Brent Crude spot prices down 17.3% and 19.5%, respectively, year-to-date in the first week of November.
Markets highly correlated with the oil and gas industries have been feeling the pressure of low commodity prices, but lower prices have given consumers more spending power, as retail gas prices have decreased by over 25.0% year-over-year as of the first week in November. The following graph presents year-to-date crude oil spot prices through the first week in November.
A deceleration in the pace of growth was also noted within the Chicago and Richmond Districts. Similar to the Kansas City District, economic activity in the Chicago District was restrained by softer conditions in the manufacturing and agricultural sectors. Although year-to-date twenty-foot equivalent unit (TEU) activity was up over 8.0% at the ports in Baltimore, Charleston, and Norfolk, a slowdown in overall port activity was noted in the Richmond District during the third quarter, while persistently weak fundamentals in the coal market also continue to adversely impact economic conditions in the region.
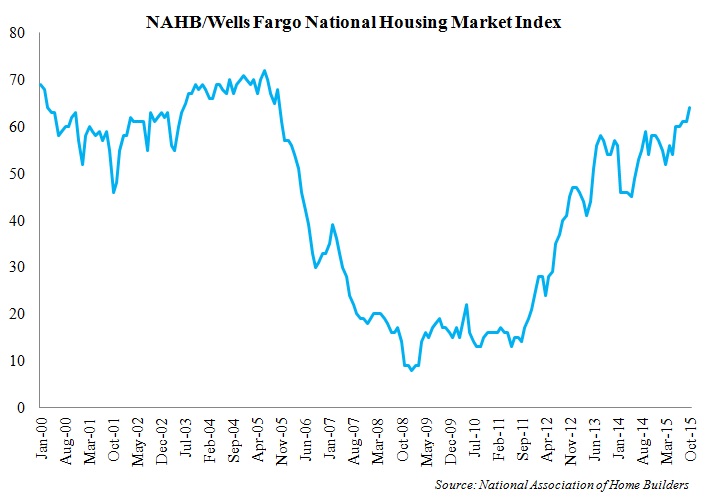
Homebuilding, business investment, and consumer spending are taking on new leadership roles in driving economic growth and are supporting growth in the face of global economic turmoil. Facilitated by a healthy employment market, the housing sector has been a bright spot for the economy, while outlays for capital equipment are bolstering business investment. Demonstrating optimism within the housing sector, the National Association of Home Builders (NAHB)/Wells Fargo National Housing Market Index increased to 64 in October of 2015, marking the highest level recorded since October of 2005. The following graph presents the historical NAHB/Wells Fargo National Housing Market Index.
Retail sales show improvement
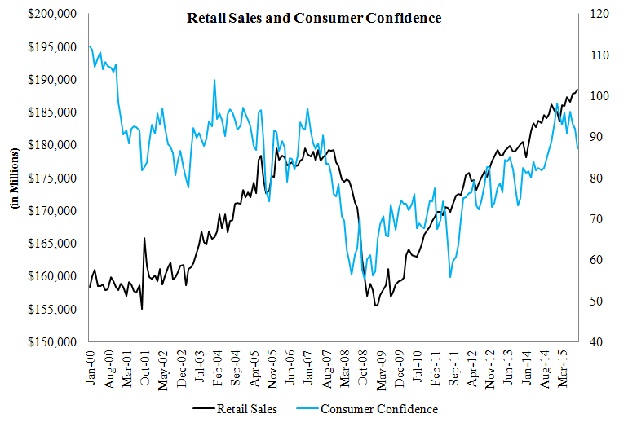
Although consumer confidence decreased in the final month of the third quarter, retail sales levels continued to show improvement through the close of the third quarter. Retail sales volume is up nearly 2.5% year-over-year, with food and beverage expenditures increasing by over 3.0%. Though overall consumer spending levels are encouraging, sales of automobiles and other long-lived, low threshold items are fostering a significant portion of retail sales growth, which creates some caution looking forward. The following graph presents national retail sales figures and the Consumer Confidence Index through the third quarter of 2015.
 In addition, public spending is on pace to add to the nation’s economic growth for the first time in five years.
National employment levels increase
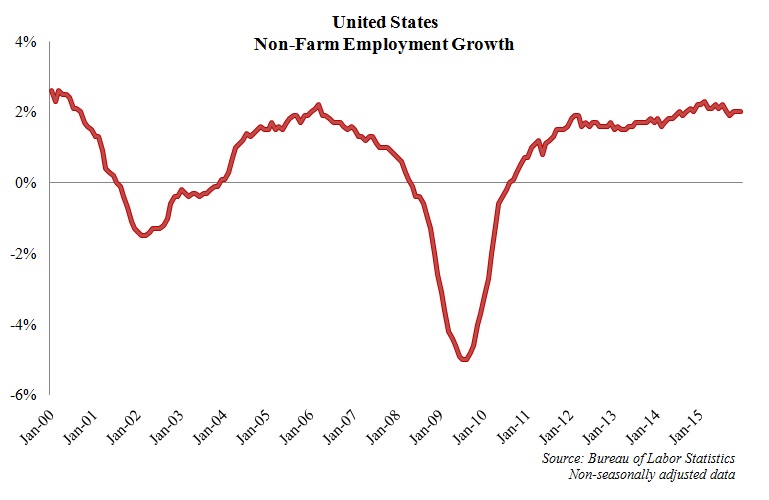
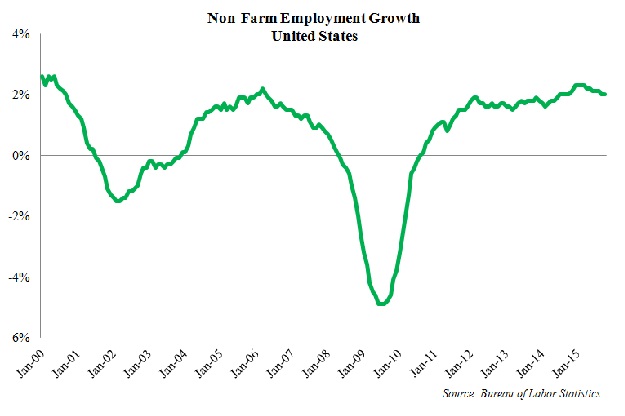
Mirroring the pace of growth noted 12 months prior, non-farm employment at the national level increased by 2.0% year-over-year in September of 2015 on the net addition of approximately 513,000 jobs in the third quarter of 2015. A stronger dollar is proving to be a significant obstacle for growth in the manufacturing and leisure/hospitality sectors at the national level, with weakness in the energy sector also resulting in cutbacks at some manufacturers and declining average weekly hours and overtime of production in the manufacturing sector as a whole. In spite of these obstacles, solid job growth figures drove the nation’s non-seasonally adjusted unemployment rate down to 4.9% in September of 2015, down 30 basis points from the month prior and down 80 basis point from 5.7% reported in September of 2014. The following graph presents year-over-year non-farm employment growth at the national level.
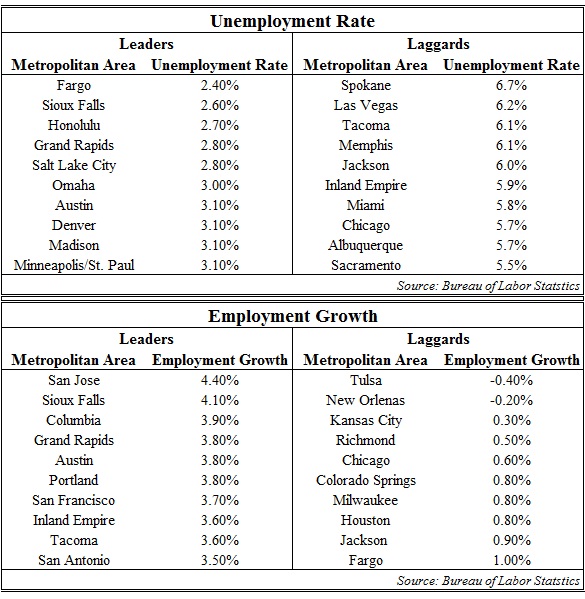
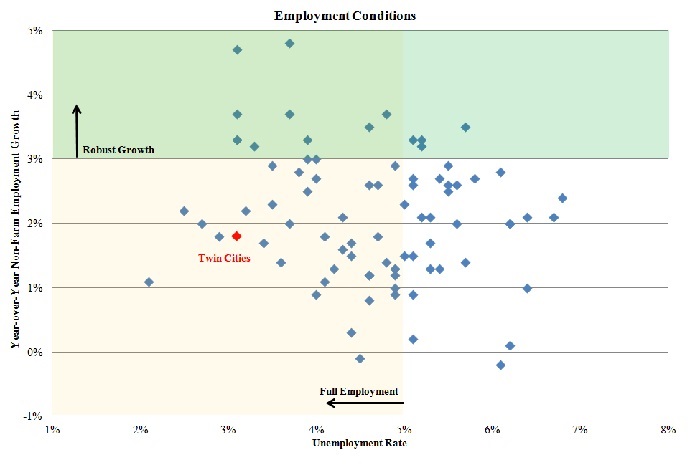
 Conditions in the labor market are healthy in the majority of major markets across the nation, with a significant percentage of markets noting strong job growth in already existing tight markets. Over the year ending in September of 2015, 16 of the 82 largest metropolitan areas in the nation noted year-over-year employment growth in excess of 3.0% at the close of the third quarter of 2015, with 12 of the 16 metropolitan areas also boasting unemployment rates below 5.0%. Only two of the 82 largest metropolitan areas, including New Orleans and Richmond, noted year-over-year job losses during this period. Unemployment rates remain below 5.0% in 49 of the 82 markets, with a growing number markets reporting unemployment rates below 3.0%. The following graph presents employment conditions in the nation’s 82 largest metropolitan markets.
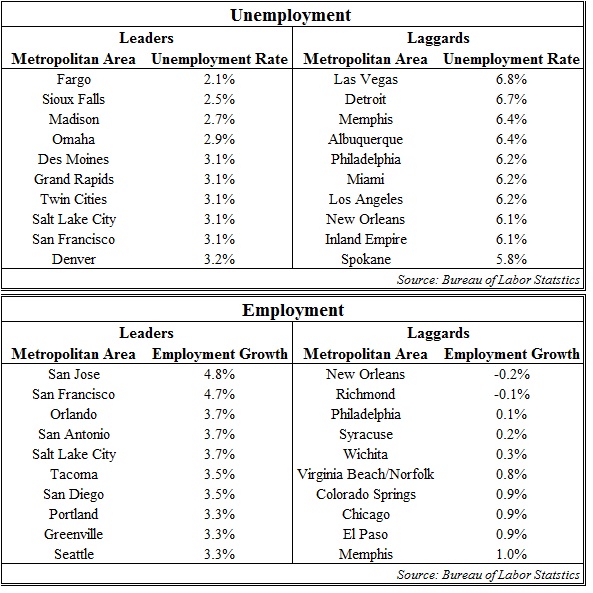
 As a whole, unemployment rates remain lowest within markets in the Midwest region, while employment growth remains strongest within markets in the West region. The following tables present the nation’s top 10 leaders and laggards among unemployment rates and employment growth.
Economic indicators remained flat
Several leading indicators slipped or remained essentially flat during the third quarter, but readings still suggest a moderate pace of economic growth will continue into the near term. The Conference Board Leading Index® dipped to 123.3 in September, down from 123.5 reported in the prior two months, yet the index continues to suggest a moderate pace of economic expansion in the months ahead. The NFIB Small Business Optimism Index stood at 96.1 in September and into October of 2015, compared to 95.3 reported in September of 2014 and 96.1 noted in October of 2014. Increasing dramatically over the last 12 months, the quality of labor has risen into the top three most important concerns among small business owners, moving ahead of concerns over sales in priority. According to the most recent NFIB Small Business Economic Trends report, other major concerns include taxes and government regulations and red tape.
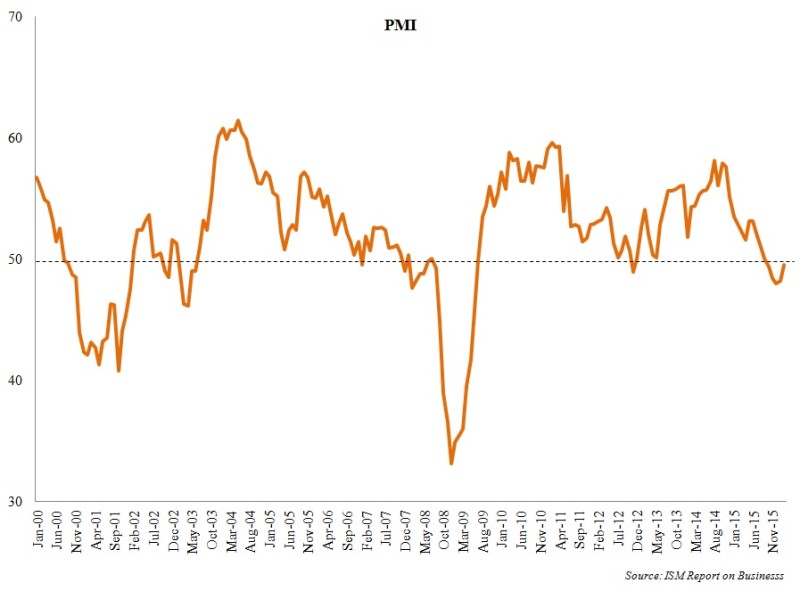
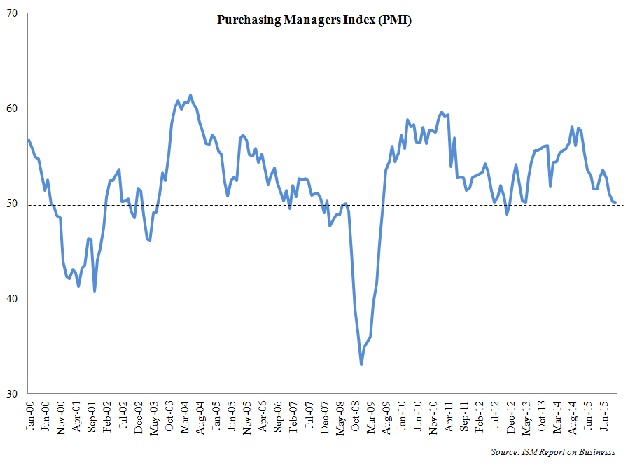
Though bordering on contraction, economic activity in the manufacturing sector expanded for the 34th consecutive month in October. According to the ISM Report on Business®, the Purchasing Manager Index (PMI) was recorded at 50.1% in October, down slightly from 50.2% noted in the prior month, with seven of 18 manufacturing industries reporting growth in October. Indicative of slower growth, the Manufacturers Alliance/MAPI Foundation reports manufacturing production is very uneven among industries, but anticipates the overall level of manufacturing activity will increase by 2.0% in 2015. The following graph presents the historical PMI from 2000 through October of 2015.
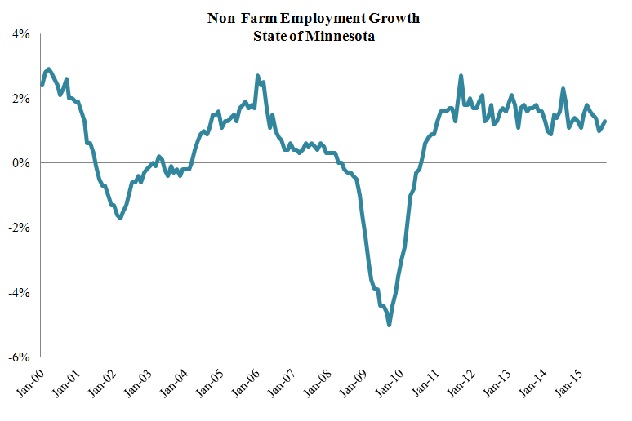
State of Minnesota employment still growing
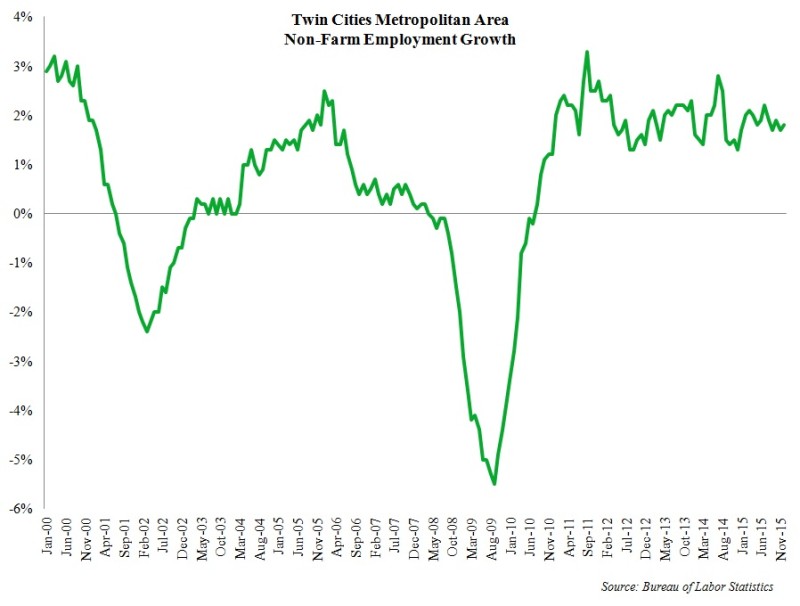
Non-farm employment growth in the state of Minnesota increased by 1.3% over the year ending in the September of 2015, slightly outpacing the 1.1% year-over-year gain noted in September of 2014. The following graph presents historical year-over-year non-farm employment growth in the state of Minnesota.
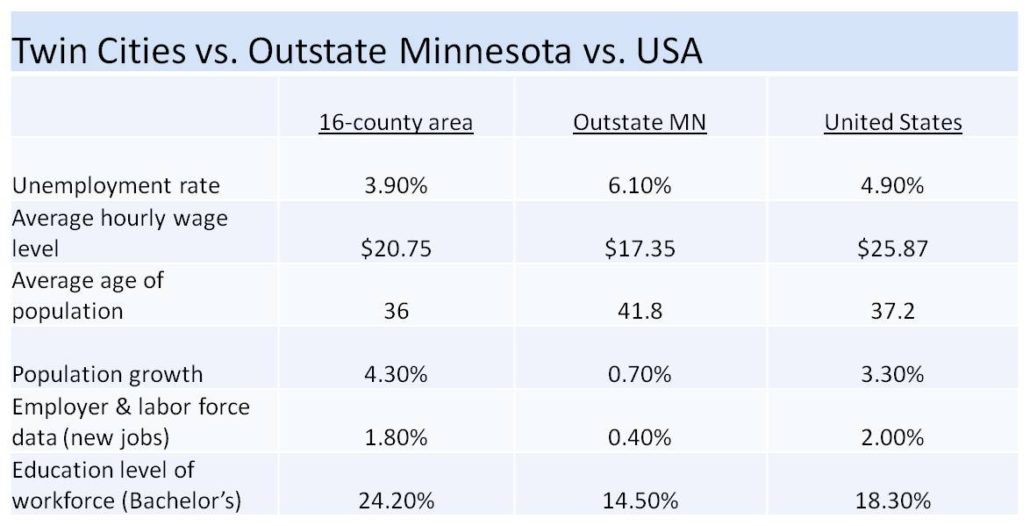
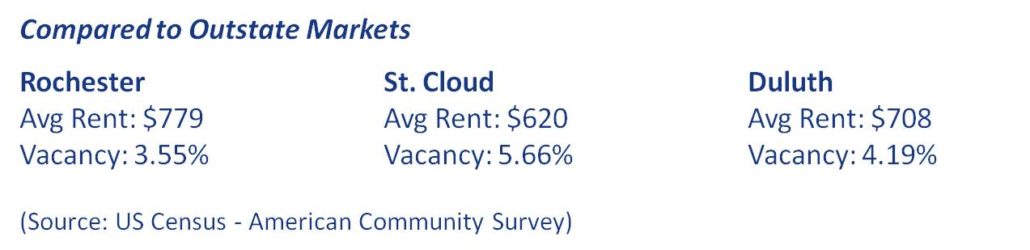
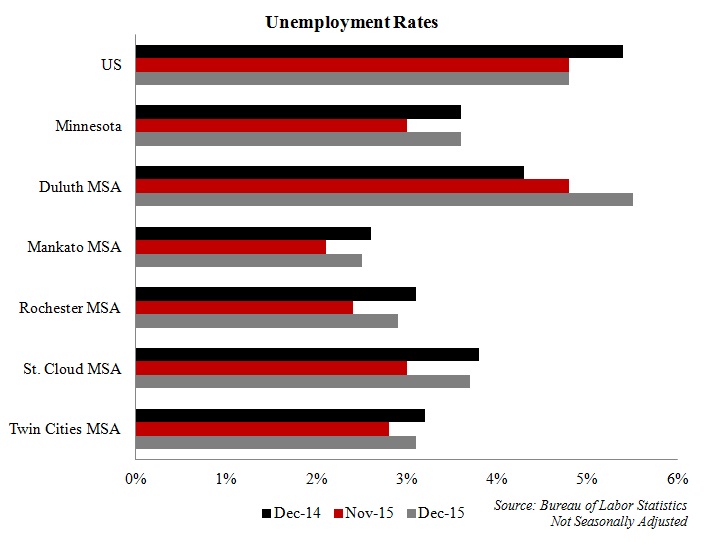
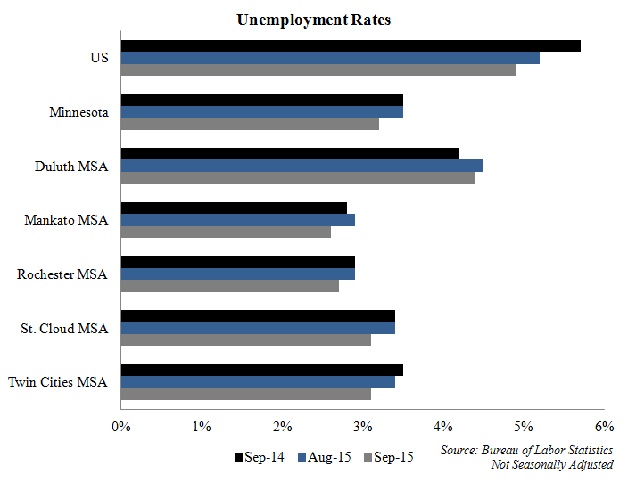
 Facilitated by positive job growth, the non-seasonally adjusted unemployment rate in the state of Minnesota fell to 3.2% in September of 2015, down 30 basis points from 3.5% noted in the prior month as well as in September of 2014. The unemployment rate in the state of Minnesota continues to track below the national level, and unemployment levels remain tight in markets throughout the state. As of September of 2015, the unemployment rate remains lowest in the Mankato area (2.6%), followed by Rochester (2.7%), Minneapolis-St. Paul (3.1%), St. Cloud (3.1%), and Duluth (4.4%). The following graph presents unemployment rates for MSA markets in the state of Minnesota, the state of Minnesota, and the United States.
 Twin Cities employment up
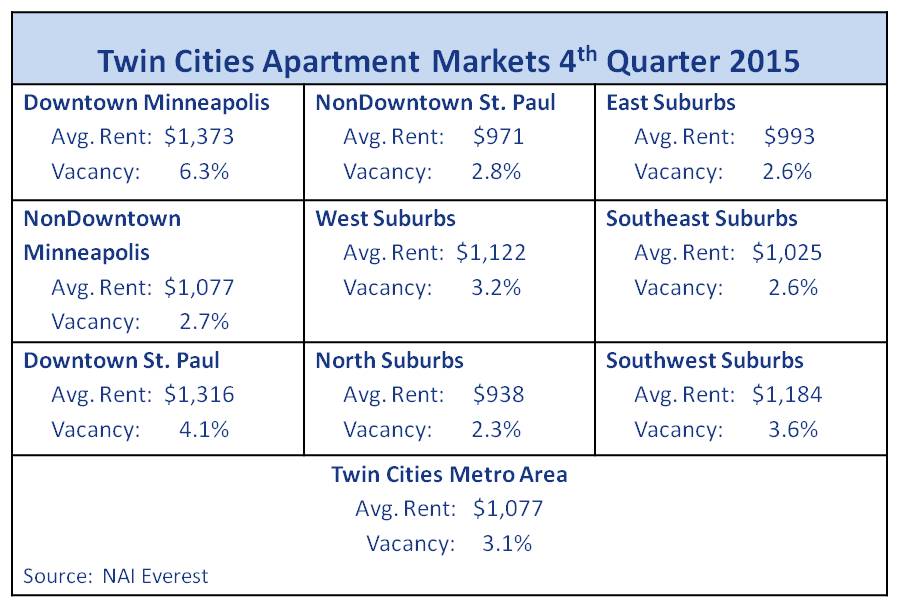
Non-farm employment in the Twin Cities metropolitan area increased by 1.8% over the year ending in September of 2015 on the net addition of approximately 35,300 jobs. Combining to add nearly 22,000 jobs, the leisure/hospitality (4.8%) and professional/business services (4.4%) sectors led job growth during this period. Employment gains in the leisure/hospitality sector were driven by hiring activity within the food service and accommodations industries, while rising payroll figures within the professional/business services sector were bolstered by strong growth within the computer system design and services industries. Further growth in the region was held back by losses in the public, information, and traditionally, low-wage other services sectors.
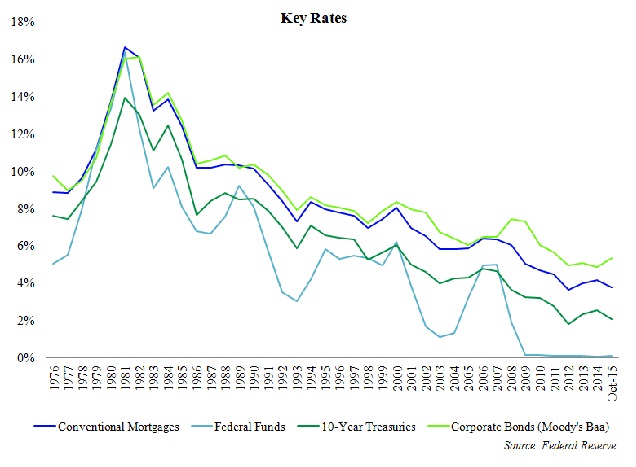
Capital markets – when will the Fed raise rates?
Anticipation of the Federal Reserve lifting its benchmark rate for the first time in nearly a decade continues to build, yet officials are reinforcing that any rate increases will occur at a measured pace to avoid disrupting a fragile global economy. As of the second week in November, the CME Fed Watch indicates there is a 70.0% probability of a rate hike in December, while 85.0% of respondents expect an increase in rates at least by March of 2016. According to a more recent poll of business and academic economists conducted by The Wall Street Journal, approximately 92.0% of respondents expect the Fed to raise its benchmark federal funds rate in December. Regardless of exact timing, a rate hike in the immediate term appears inevitable, yet interest rates will remain at historically low levels through at least the near-term.
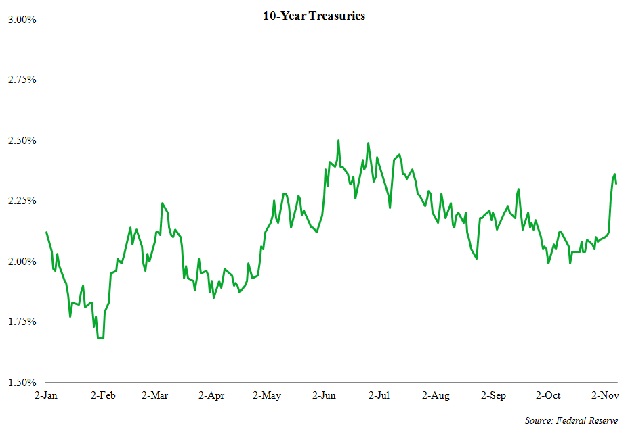
 Although rallying in the first week of November, the 10-Year Treasury is unlikely to increase in lock step with any increases in short-term rates, due to robust demand for risk-free assets, though volatility is anticipated.
 Rising yields for corporate bonds may pull some capital away from the commercial real estate sector in the near-term, but the bigger impact in rising corporate bond yields is on the return expectations from commercial real estate assets. Alternative investments, such as commercial real estate assets, continue to offer far greater upside than bonds. While the bond market offers investors greater liquidity, commercial real estate assets provide an investor the ability to take advantage of net operating income growth and property appreciation. Competitive pressures and robust flows of capital will continue to support improvements in the commercial real estate market, putting further upward pressure on prices and downward pressure on capitalization rates as spreads narrow closer to historical norms.
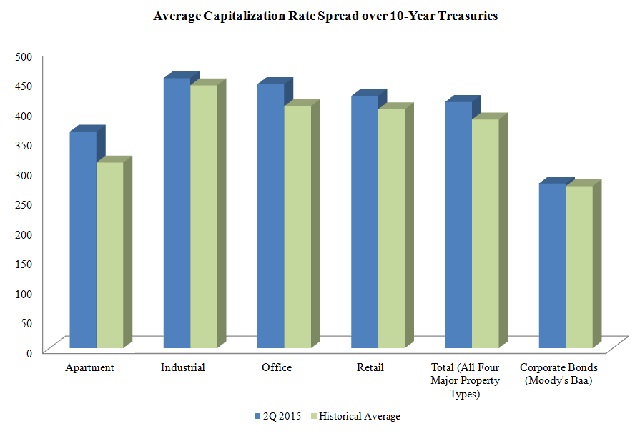
 Among property types, the average capitalization rate spread over 10-Year Treasuries remains widest compared to historical norms within the apartment sector. Capitalization rates continue to compress for apartment assets in most markets and across all property classes, and spreads between primary and secondary/tertiary markets as well as among the upper and lower tiers are tightening, demonstrating strong competition for riskier assets as investor search for higher yields. Spreads tightened in the second quarter of 2015 compared to the first three months of year across all property sectors, with the most substantial compression observed within the industrial sectors.
 Apartment market projected to remain healthy
Employment growth and new household formation is driving healthy to strong demand for apartments units across most major markets, though the pace of new construction activity is also accelerating in most major markets and on the verge of outpacing absorption at the national level. In spite of a robust construction pipeline and signs of stronger competition from the for-sale residential sector in a number of major markets, national and regional vacancy rates have not been materially affected. At the national level, the average apartment vacancy rate has remained in a tight band within the low 4.0% range over the last ten quarters. Tight vacancy rates are facilitating rent growth, with asking rents increasing across all tiers. Asking rents are forecast to increase in the mid 3.0% range by the close of 2015 compared to the year prior, essentially matching the pace set in 2014. Effective rent growth in the Class ‘B/C’ segment is outpacing effective rent growth in the Class “A’ segment.
Conditions in the apartment market are projected to remain healthy through at least the near term and into the long term. Favorable demographic trends are expected to support demand, and the apartment market is expected to continue to capitalize on improvements within the labor market, as the brighter employment picture and outlook for entry-level workers and recent college graduates helps to unleash pent-up demand and new household formation from this cohort.
Homeownership rates fall to lowest level in 50 years
While the for-sale sector has demonstrated some renewed vigor, homeownership rates have fallen dramatically and are not likely to reach back up to peak levels in the foreseeable future. Homeownership rates have fallen to the lowest levels recorded in nearly 50 years, decreasing from a peak of 69.2% in the fourth quarter of 2004 to 63.7% in the third quarter of 2015. Homeownership rates have declined across all age cohorts, but have decreased most noticeably within the prime first-time home buyer cohort, age 35 to 44. The national homeownership rate for this cohort declined to 58.1% in the third quarter of 2015, down from 70.1% recorded at peak in the first quarter of 2005. As of the third quarter of 2015, homeownership rates are lowest in the West region (58.7%) and highest in the Midwest region (68.1%), but rates across all regions are significantly lower compared to pre-recession peak levels.
At minimal expense to the apartment market, the for-sale residential sector continued to gain traction through the first nine months of 2015. The national median single-family home sale price rose from $217,100 in the third quarter of 2014 to $229,000 in the third quarter of 2015, increasing by 5.5%. Rising home sale prices were noted across all regions, but growth was strongest within the South and West regions. Median single-family home sale prices in the San Jose (12.2%), Denver (11.9%), and San Francisco (10.7%) markets all increased by over 10.0% year-over-year in the third quarter of 2015. A number of markets in the state of Florida also reported year-over-year growth in excess of 10.0%, including the Tampa-St. Petersburg market, which witnessed the median single-family home sale price increase by 20.7% over the year ending in September of 2015.
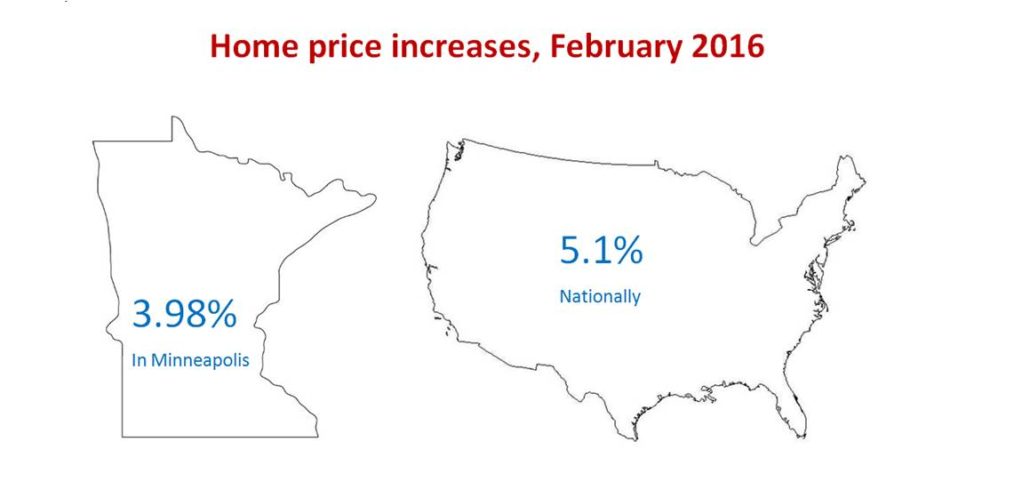
Twin Cities for-sale market – increased activity and prices
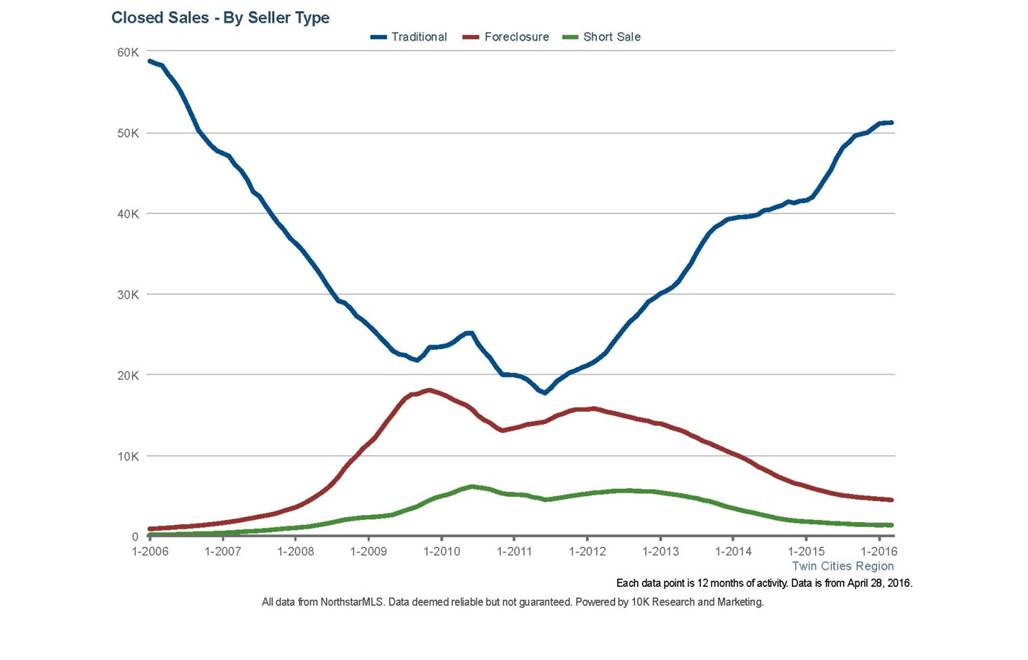
Highlighted by growth in several important metrics, activity continues to increase in the Twin Cities for-sale residential market. Year-to-date closed sale transactions in the Twin Cities market were up 15.6% in September of 2015, increasing from 38,185 in the first nine months of 2014 to 44,138 through the first three quarters of 2015. Increasing competition among home buyers drove the median home sale price up 6.8% year-over-year in September of 2015, while the number of days on market decreased by 2.6% during this same period. Increasing from $206,000 in September of 2014 to $220,000 in September of $220,000, the median home sale price in the Twin Cities market is up nearly 15.0% compared to 2013. Meanwhile, the average number of days on market has decreased by over 40.0% compared to 2010. Positive trends within the local market are encouraging potential sellers to bring inventory to market, with new listings up 5.6% year-to-date in 2015, but momentum within the for-sale residential sector is likely to take a significant hit if and when interest rates tick upward.
Industrial market continues to be healthy
Although the strong dollar and weakness within the energy sector have held back further growth at the national level, the emergence of e-commerce has led to demand outstripping the pace of new deliveries within the industrial sector. Encouraging demand for warehouse and distribution space, e-commerce sales growth is far outpacing sales growth at traditional brick-and-mortar stores. Although less robust, absorption within the light industrial and flex/R&D segments also remains positive through the first nine months of 2015. Vacancy rates have ticked downward in the face of stronger levels of new supply, facilitating a health pace of rent growth.
Demand in the Twin Cities industrial market continues to be healthy, and strong operating fundamentals are encouraging speculative development in the region. Mirroring trends observed at the national and regional levels, demand in the Twin Cities industrial market has been strongest within the warehouse/distribution segments. Warehouse/distribution and bulk warehouse space accounts less than 35.0% of all industrial space in the Twin Cities market, but has accounted for over 55.0% of all year-to-date absorption in 2015.
Sparking a sizeable amount of demand in the local market, the rise of e-commerce has been a significant boon for the Twin Cities market and other tertiary markets in the state of Minnesota. Positioned at the intersection of Highway 169 and Highway 14, the Mankato area is a prime example, as demonstrated by FedEx and Wal-Mart selecting sites along the Highway 14 corridor in Mankato for new distribution centers. Wal-Mart officially opened the company’s $75 million distribution center in August, while the FedEx facility was sold in September for $7.45 million or approximately $81.85 per square foot.
Office market recovery is accelerating
Surpassing previous peak levels by approximately 5.0%, employment among the traditionally office space using sectors has reached new record levels. The pace of absorption within the national office market was is up nearly 25.0% year-to-date compared to the first three quarters of 2014, as improvements in the labor market are spurring demand for office space. Headwinds, including denser tenant space requirements, continue to linger and the recovery remains moderate compared to historical norms, yet the pace of recovery is accelerating, and vacancy rates at the national level have fallen to the lowest level since 2009. In turn, the pace of effective rent growth in the office market is increasing and now on par with the growth rate observed in the apartment market. Positive momentum in the office market continues to build, but the new construction pipeline is also widening, though speculative building remains at relatively low levels yet increasing.
Occupancy levels in the Twin Cities office market are above the national average, but new construction is underway on several major developments that will introduce a significant amount of new supply to the market’s existing inventory. Combined with smaller per employee space requirements, a number of tenants are simply shuffling into new space from existing footprints, which will put upward pressure on vacancies as new supply is delivered and likely result in softer vacancy rate within segments of the local market.
Retail market experiencing expansions and demand
Although remaining bifurcated, the retail sector at the national level is moving along swiftly in the recovery process. Retailers are following through on planned expansions and increasingly signaling an appetite for new space. Stronger demand and historically modest levels of new construction activity are pushing occupancy levels higher and facilitating a solid pace of rent growth, as landlords gain more leverage in negotiations. Absorption in the retail sector outweighed new supply for the 14th consecutive quarter in the third quarter of 2015. New construction activity remains relatively muted, and trends within the sector include new space being delivered within mixed-use projects and entertainment destinations.
Investors have a seemingly endless appetite for single-tenant net lease assets, while demonstrating a renewed interest in community shopping centers and regional malls in response to improving fundamentals. Sales volume for single-tenant net lease assets remains strong across all retail categories, and strong competition has pushed capitalization rates into the low-4.0% range for well-located net lease assets with lengthy remaining lease terms and investment-grade credit tenants. Investment activity in regional shopping centers and malls surged through the first nine months of 2015, pushing sale volume in the segment up significantly and shifting cap rates downward by a sizeable amount.
Hotel market setting new average occupancy levels
Average occupancy levels may well reach new record levels in 2015, and year-over-year Average Daily Rate (ADR) growth is expected to surpass 5.0% in 2015, outpacing the 4.4% gain noted in 2014. RevPAR is forecast to increase by over 7.0% in 2015. In response to stronger operating fundamentals, new construction activity is rapidly accelerating at the national, regional, and local levels, with new deliveries at the national level forecast to increase existing supply by approximately 2.0% by the close of 2015.
An emerging trend within the hotel sector is the development of on-site airport hotels. A 14-story, 515-room Westin is scheduled to open at Denver International Airport in the fourth quarter of 2015, and over the last 18 months, Minneapolis-St. Paul International Airport, San Francisco International Airport, Baltimore/Washington International Thurgood Marshall Airport, Hartfield-Jackson Atlanta International Airport, and Kennedy International Airport have all announced plans for hosting on-site hotels. This trend is being driven by strong occupancy rates at existing on-site airport hotels, and a desire from business travelers for lodging in close proximity to airports in order to maximize productivity
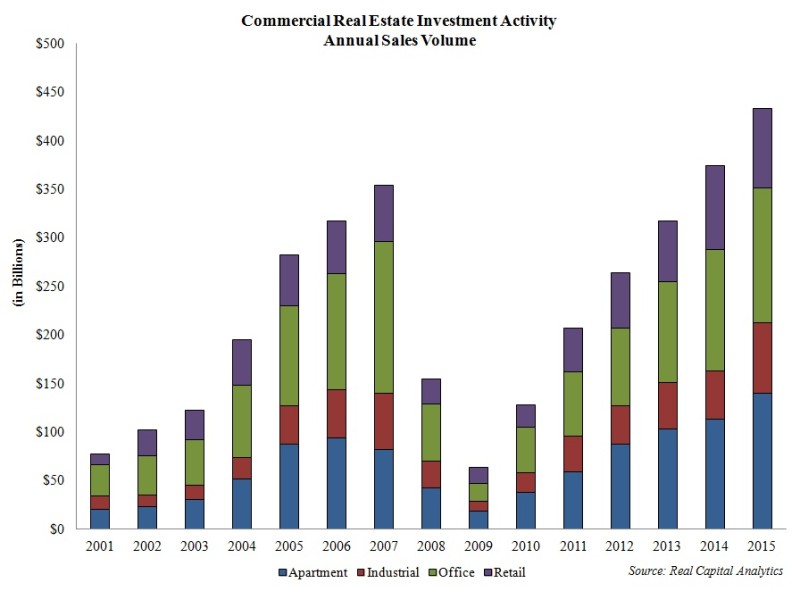
CRE investment activity is strong
Favorable financing opportunities and higher yields compared to other investment alternatives are inspiring investor interest in the commercial real estate sector, particularly for high-quality core-plus apartment and net lease assets with long remaining lease terms and investment-grade credit tenants. Through the first three quarters of 2015, sales volume in the office sector has accounted for approximately 35.0% of all sales volume among the four major property types at the national level, followed, in order, by the sales of apartment, retail, and industrial properties.
Assisted by several massive portfolio and entity-level transactions, year-over-year sales volume growth has been most robust in the office and industrial sectors, which each noted increases of roughly 30.0% in sale volume over the year ending in September of 2015. The apartment and retail sectors also recorded healthy sale volume growth during this period, with volume increasing by 9.0% and 14.0%, respectively, in these sectors. Nationwide per unit of comparison prices in the apartment, retail, and industrial sectors were all up over 10.0% in September compared to the year prior. Largely due to suburban office assets accounted for a greater composition of office sale activity, per unit prices in the office sector were essentially flat, though upward pressure on CBD office assets remains significant.
A more limited amount of availability inventory has provided investors with a challenge in placing capital, but instead of retreating from the sector, strong interest in commercial real estate assets has forced investors to expand comfort zones in term of depth and breadth of investment. Prices in primary markets and within the four main property types are reaching up to record levels, due to strong investor demand and limited available inventory. Surpassing previous pre-recession peak levels, Commercial Property Price Indices (CPPI) in the third quarter of 2015 were 14.5% above November of 2007 levels on a nominal basis and 1.5% above previous peak levels after adjusting for inflation. As a result, investors are increasingly moving into secondary markets with healthy, broad-based economies, including the Austin, Denver, Nashville, Portland, Raleigh, and Twin Cities markets. Investors are also expanding into alternative assets and niche markets on the fringes of the commercial real estate industry, and increasingly demonstrating strong interest in self-storage, data center, parking garage, and life science assets. In addition to expanding investment horizons in terms of geography and product type, investors are increasing their appetite for taking on lease-up and development risk to achieve higher returns.
Illustrating the demand for alternative assets within niche sectors along the fringes of the commercial real estate market, Blackstone agreed to purchase BioMed Realty Trust for approximately $8 billion. BioMed owns 18.8 million rentable square feet of space catering to life science tenants in the United States and United Kingdom, with a high concentration of assets in the biotechnology hubs of Boston, Raleigh, San Francisco, San Diego, and Seattle. A transaction is anticipated to close in 2016.
Identified as one of the Top 20 US Markets to Watch in 2016 by Urban Land Institute’s Emerging Trends in Real Estate report, the Twin Cities market continues to emerge among the national landscape and is taking on more of a leadership role with the Midwest region. Achieving the highest ranking of all markets in the Midwest region, the Twin Cities was trailed closely by Indianapolis (22), followed by Chicago (26), Columbus (27), and Detroit (33).
Sales velocity and volume in the Twin Cities market as well as throughout the broader Midwest region have been healthy through the first three quarters of 2015. One of the most recent notable transactions in the Twin Cities market involved Ecolab purchasing Travelers Cos. 17-story North Tower building in downtown St. Paul for $47 million in August of 2015; however, an increasing portion of sales activity and investment in the first three quarters of 2015 has included suburban office assets.
Increasing investor attention to suburban office assets has also been noted throughout the broader Midwest and national regions. In August of 2015, Duke Realty sold a portfolio of five suburban office assets to Apollo Global Management for over $100 million. A significant number of suburban office transactions in 2015 have involved portfolio sales from sellers that are transitioning away from the office sector.
Rising sales prices and valuations combined with more limited available inventory have restrained further growth, but investor interest still remains strong for CBD assets and some CBD markets are more active than their suburban counterpart. The Chicago market is a prime example of strong activity within the CBD office sector. Following a significant amount of activity in the first half of 2015, Piedmont Office Realty Trust sold the 80-story Aon Center in downtown Chicago for $712 million or $260 per square foot in July of 2015, just after signing Kraft Heinz Co. to lease 170,000 square feet at the property. Healthy demand from users and favorable operating fundamentals have been and projected to continue driving investment activity in the Chicago CDB, with Con Agra announcing plans to move the company headquarters from Omaha to downtown Chicago. Con Agra will lease 168,000 square feet in the Chicago Merchandise Mart beginning in the summer of 2016.
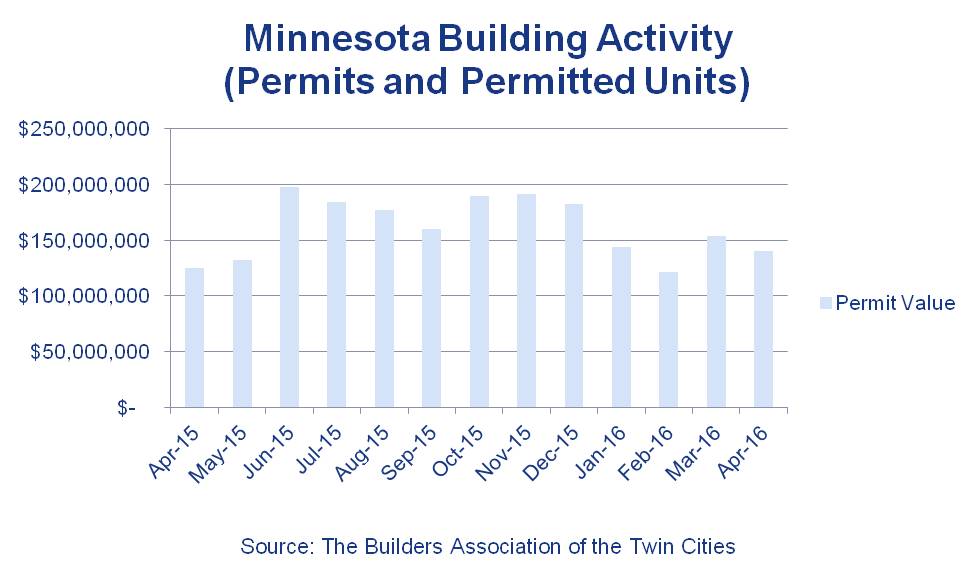
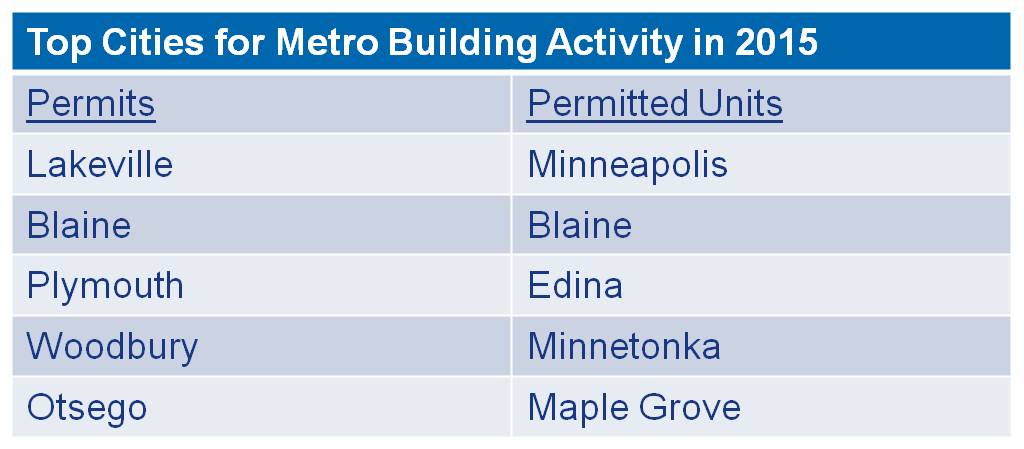
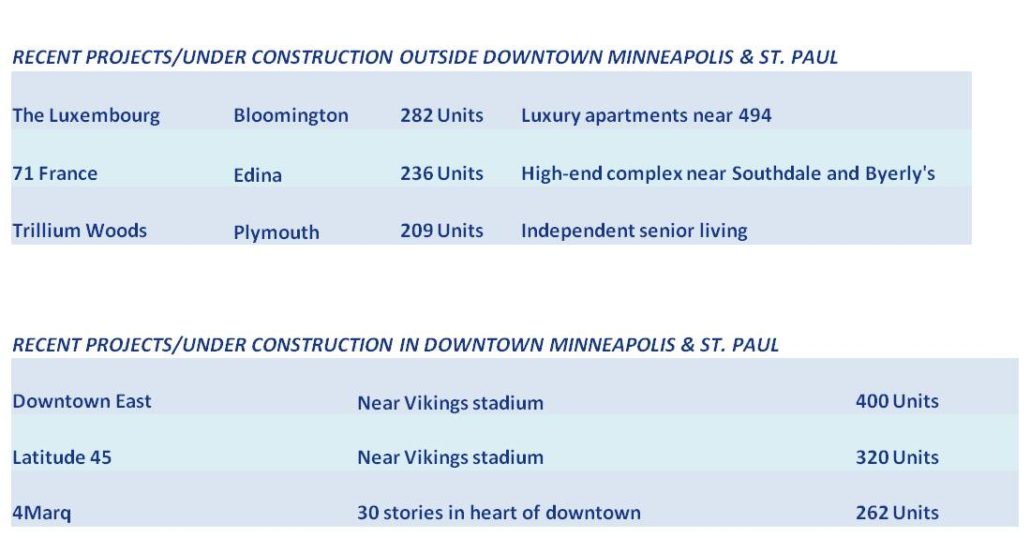
Development trends – development interest remains strong
In addition to strong competition from investors for existing assets, many secondary markets are witnessing intense interest from developers, including the Twin Cities market. For the fourth consecutive year, more than $1 billion worth of construction permits have been issued in Minneapolis. Construction in the Twin Cities has remained strong for apartments in the region’s urban core, but new development activity has not been confined to any one property type or submarket. Similar development trends are being observed in other secondary markets throughout the nation.
More than 100 new construction projects, with an estimated combined value of $2 billion, are currently underway or planned to begin construction in 2016 within the Nashville market. Development in the Nashville market is concentrated on previously underutilized parcels of land in the downtown area of Nashville. Scheduled for completion in 2017, construction is underway on a 30-story, $220 million office building that will serve as the headquarters of Bridgestone Americas. Construction is also in progress on a 27-story, $120 million Westin, which is slated for completion in late 2016. Both of these developments are located within the South of Broadway (SoBro) neighborhood core of the Nashville market, but development is also occurring along the fringes of the urban core and suburban areas.