Posts

Market View Q2 2015

Economic and Real Estate Market Snapshot

Article Highlights:
•   U.S. employers added approximately 664,000 jobs in the second quarter of 2015
•   90% of surveyed Minnesota businesses positive about economy
•   Activity in the manufacturing sector expanded for the 30th consecutive month
•   Economic growth is supporting improvements in the CRE market, but new development activity is accelerating
•   Construction spending climbs to the highest level in six years
•   Home builders are the most optimistic since 2005
•   U.S. office construction activity was up nearly 25.0% from second quarter 2014
•   U.S. retail vacancy rates are projected to drop 30 to 50 basis points from one year prior
•   Tightening spreads are likely to hold cap rates near historic lows

National Economic Landscape

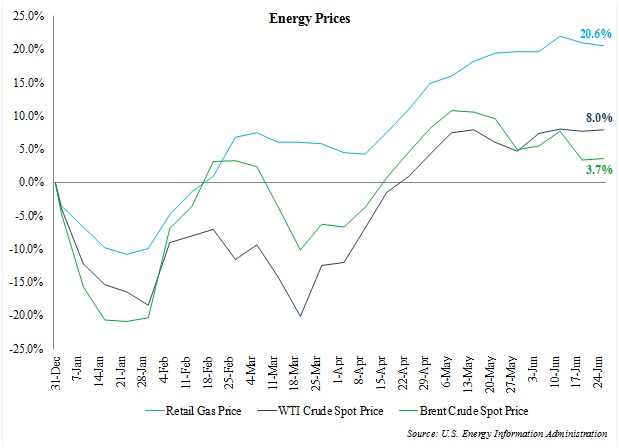
Several headwinds that held back economic growth in the first quarter of the year began to fade going into the summer of 2015, yet new obstacles came to the forefront during the final weeks of the quarter that largely overshadowed progress made in the second quarter. Temporary economic drags in the first quarter of 2015, burned-off going into the second quarter of the year. Meanwhile, concerns about a strengthening dollar and spending cuts in the energy sector began to ease. After a strong performance in the early months of 2015, the dollar rally began to stall and demonstrate signs of weakening in the second quarter, retracing 1.5% from March to June. Meanwhile, the selloff in crude oil also paused in May into June, with NYMEX crude oil futures at the close of the second quarter up approximately 23.0% compared to the end of March. Retail gas prices as well as WTI Crude and Brent Crude spot prices were also up year-to-date at the end of June yet lower compared to year-ago figures. The following graph presents year-to-date retail gas and crude oil spots prices through the second quarter of 2015.

EnergyPrices

Economy seeing modest or moderate growth

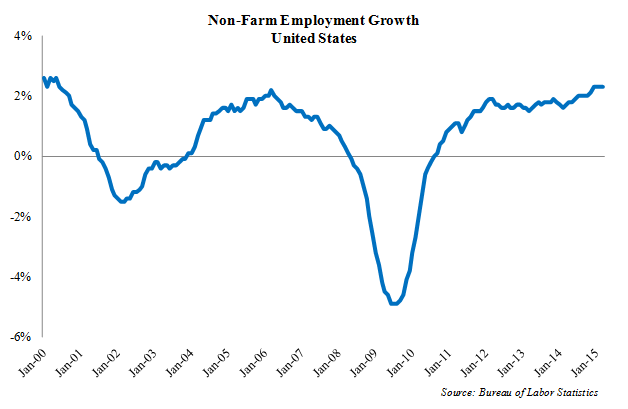
According to the latest Federal Beige Book, seven of twelve Federal Reserve Districts, including the Minneapolis District, reported observing modest or moderate growth into the second quarter of 2015. Outpacing the 1.9% year-over-year increase noted 12 months prior, non-farm employment at the national level increased by 2.1% year-over-year in June of 2015 on the net addition of approximately 664,000 jobs in the second quarter of 2015. Employment gains in the second quarter were largely supported by growth within the professional/business services, education/health services, and financial activities sectors. The following graph presents historical year-over-year national non-farm employment growth.

NonFarmEmployGrowth

Construction Spending Climbs to Highest Level in Six Years

The downturn in the oil and gas industry is hampering manufacturing activity, but growth in the construction sector is anticipated to pick up some of the slack in the labor market left by softer energy prices. Led by a combination of both public and private development activity, construction spending advanced by over 2.0% in the second quarter, climbing to the highest level in more than six years. Further, the labor market for skilled construction workers remains tight, as a significant percentage of skilled trade workers exited the construction industry following the housing bust in 2007-2008 and have yet to return, putting upward pressure on wage growth.

Manufacturing Sector Expanded

While the notable slowdown in the oil and gas markets have served as a drag on manufacturing activity, economic activity in the manufacturing sector expanded for the 30th consecutive month in June, with 11 of 18 manufacturing industries reporting growth. According to the latest ISM Report On Business, the manufacturing sector expanded at a slightly faster pace at the close of the second quarter, as the PMI registered 53.5% in June, up from 52.8% in the prior month but down from 55.7% recorded one year prior. Non-manufacturing activity also increased as the ISM Non-Manufacturing Index was recorded at 56.0% in June of 2015, up slightly from 55.7% in May of 2015. Additionally, nine of ten indicators that comprise The Conference Board Leading Economic Index (LEI) were up in May. Increasing to 123.1 in May of 2015, the two largest contributors to the LEI during this period were building permits and the interest rate spread.

U.S Economy Will Continue Growth Pattern

Supported by improvements in the labor market and healthy consumer confidence, economic growth is expected to accelerate in the second half of 2015, with domestic GDP projected to increase in the mid-2.0% to 3.0% range in 2015. Business spending is forecasted to increase by 4.0% during the year, with further growth held back by energy firms tightening their belts. Meanwhile, disposable income is expected to increase in the mid-to-high 3.0% range in 2015, as a tight labor market puts more upward pressure on wages. In sum, the underpinnings for domestic economic expansion are in place.

State of the State – Minnesota Employment Strong

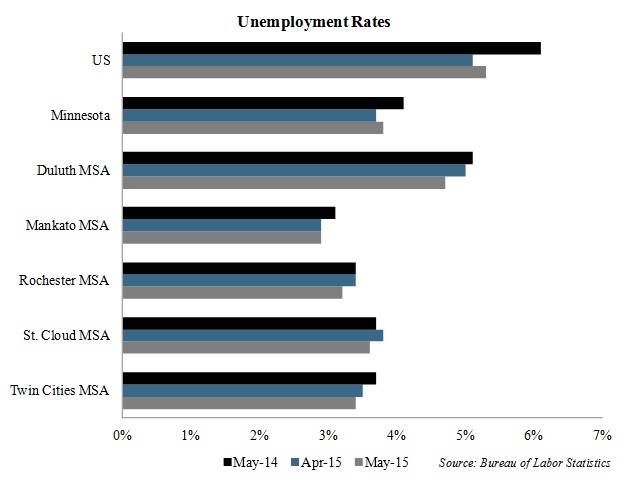
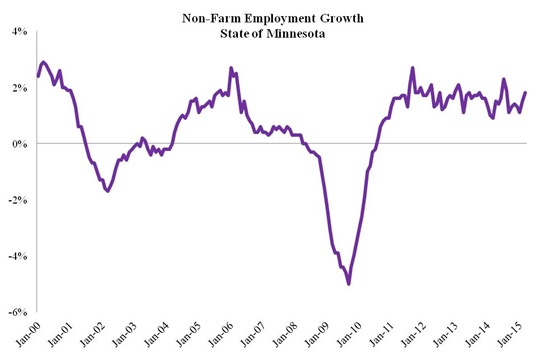
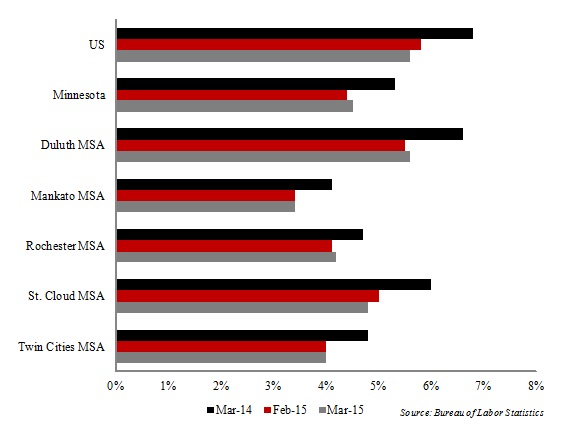
Non-farm employment at the statewide level increased by 1.5% year-over-year in May of 2015 on the net addition of approximately 42,600 jobs, as payroll figures statewide increased by roughly 20,500 in the first five months of 2015. The trade/transportation/utilities sector emerged as a growth leader among employment sectors in the second quarter of 2015, but increasing payroll figures were posted across nearly all employment sectors. As a result, the unemployment rate in Minnesota decreased to 3.8% in May of 2015, down 30 basis points from 4.1% reported 12 months prior, though up 10 basis points compared to 3.7% posted in April of 2015. The unemployment rate in Minnesota continues to compare favorably with the national level, which reported a non-seasonally adjusted unemployment rate of 5.3% in May of 2015. Among regional MSA markets in Minnesota, the unemployment rate remains lowest the Mankato area (2.9%), followed by Rochester (3.2%), Twin Cities (3.4%), St. Cloud (3.6%), and Duluth (4.7%). The following chart presents unemployment rates for regional MSA markets, state of Minnesota, and the United States.

UnemploymentRate

MN Businesses Positive About Economy

A recent survey conducted by the Minnesota Department of Employment and Economic Development (DEED) and Federal Reserve Bank of Minneapolis indicated that Minnesota business service firms have a positive outlook about the economy. Over 90.0% of the 261 respondents said they expect the overall state economy to remain on its current course or improve in the next year, while 88.0% signaled expectations for revenue to increase or remain stable in the coming year.

New MN Jobs Announced by Employers

In addition to an optimistic statewide economic outlook, several companies announced plans during the second quarter to expand existing operations and add jobs. A jobs bill was approved in June that included public funding for Cirrus Aircraft to build out a 60,000-square-foot painting facility that will help keep existing operations in Duluth and is anticipated to help create between 150 and 300 jobs. Anderson Corporation had its official opening of the company’s newest manufacturing facility in Bayport in April. Accompanying the official opening was an announcement of plans for a second major expansion at the company’s Cottage Grove and North Branch facilities, which is projected to add over 300 new jobs. Artic Cat, Blattner Energy, Caterpillar, Dubow Textile, Mendell, Inc., and Rahr Malting Corporation also announced plans for expansions during second quarter that could combine to add up to over 150 jobs and roughly $200 million in investments.

Residential Real Estate Market on the Upswing

After another sluggish start in the early months of 2015, the for-sale residential market experienced improvements through the first half of 2015. Total existing home sales at the national level were up nearly 10.0% year-over-year in May of 2015, while the median home sale price increased by 7.9% during this period, rising to $228,700 in May of 2015. Supported by more first-time buyers entering the market, total existing home sales increased year-over-year for the 8th consecutive month in May. First-time buyers accounted for over 30.0% of home sales in May, up from the year prior, while the percentage of sales to investors, cash sales, and distressed sales all decreased during this same period. Healthy employment growth and compelling rent-to-own metrics are expected to continue to convince some tenants to leave the renter pool in favor of homeownership and encourage activity in the for-sale residential market.

Home Builders Most Optimistic Since 2005

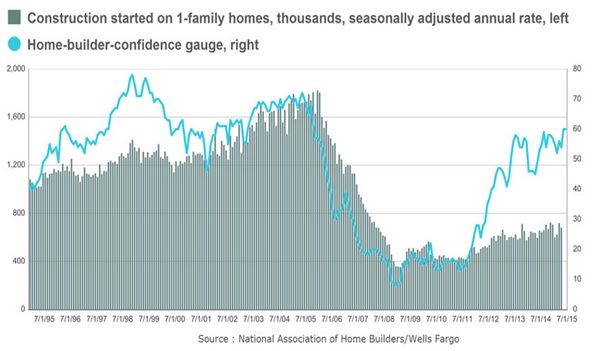
Recent consumer trends have given home builders a more optimistic outlook, and bolstered by strong growth in new orders, confidence among home builders rose the highest levels since the fourth quarter of 2005. The National Association of Home Builders/Wells Fargo Housing Market Index increased to 60 in June of 2015, up from a reading of 54 in the previous month and 52 at the close of the first quarter of 2015. In spite of rising confidence among home builders and stronger home permitting activity, single-family home construction starts, though increasing, remain modest compared to more historical norms. The following graph presents a ten-year historical view of construction starts and home builder confidence.

HomeBuilder

Twin Cities Residential Market Strong

Conditions in the Twin Cities for-sale residential market are stronger than the national level. Although average days on market remained unchanged on a trailing twelve month basis, home sale transactions in the Twin Cities market were up 15.9% through the first six months of 2015 compared to the first six months of 2014, while pending sales were also up significantly. New listings increased by nearly 10.0%, yet the for-sale inventory declined by 9.4% in June of 2015, as the supply of available inventory fell to 3.6 months in June. Spurred by more robust transaction activity, a limited amount of available inventory, and declining distressed sale activity, the median home sales price increased by 9.0% in the first half of 2015. Looking forward, stronger home sale prices should begin to encourage homeowners to bring more inventory to market.

Apartment Market Healthy

At both the national and local levels, progress in the for-sale residential market has yet to adversely affect conditions in the apartment market, though demand is likely to struggle to keep pace with the amount of new supply scheduled to be delivered over the next 12 to 18 months. Despite a robust construction pipeline and wave of new deliveries, the vacancy rate in the national apartment market stood at 4.2% in the second quarter of 2015, remaining essentially unchanged. Effective and asking rents were up 3.6% and 3.4%, respectively, on a year-over-year basis in June. Occupancy levels within the Twin Cities apartment market have remained strong in recent years and rent growth is being observed across all submarkets in the local market.

Favorable demographic trends remain intact to support healthy absorption and maintain strong occupancy levels in the apartment market. Facilitating demand, the pace of new household formation is projected to increase in near lock step with an expanding economy and growing employment base, while immigration will also add to the pool of potential renters. Although demand drivers are in place to support solid absorption figures, operating fundamentals in both the national and local apartment markets will continue to be tested by the addition of new supply through the near-term. Approximately 150,000 units are scheduled to reach lease-up at the national level in the final six months of 2015, and new apartment construction remains strong in the Twin Cities market. Although unemployment rates and the overall labor market have improved in recent years, we anticipate the pace of rent growth within the Class ‘A’ segment will ease as new development reaches lease-up. We also anticipate effective rent growth among lower-tier properties will be comparatively modest until wage growth within the core renter demographic faces additional upward pressure.

Industrial Sector Activity Increasing

All major industrial markets have entered into at least the recovery phase of the real estate cycle, with most major markets demonstrating expansion. E-commerce trends continue to serve as a significant tailwind for the industrial sector, though posing a drag on the retail sector, while the manufacturing sector also continues to demonstrate overall expansion. E-commerce trends have provided a healthy boost in the local market, as the Twin Cities market becomes more important in the national distribution chain with the rise of next-day delivery.

Largely aided by demand for bulk distribution and logistics space, healthy absorption and tight occupancy rates are forecasted through at least the near-term in the industrial sector, but the pace of speculative building within the industrial sector may temper expansion in some markets. Despite increasing new industrial construction activity, the shorter development cycle for industrial development compared to other property types affords developers the ability to be more nimble and react faster to any change in market conditions. Further, consumer demand in terms of functionality and technology for industrial buildings is changing at a faster pace and making older inventory obsolete more quickly. Consumers are demanding higher clearance heights, larger bays, more room for parking, and ample space to allow for the loading and unloading of cargo.

Office Market Seeing Improvements

Although employers are squeezing into denser space and a more cautious outlook compared to previous cycles continue to serve as significant headwinds, the national office market has demonstrated solid improvements since the start of 2015, and vacancies in the office sector are projected to edge downward on positive absorption over the next 12 months. Absorption will remain strongest within the Class ‘A’ segment as tenants seek to lock in rents, and conditions will remain comparatively stronger in high barrier-to-entry markets and Central Business District submarkets.

While progress has been noted in recent quarters, the pace of new office construction activity is accelerating rapidly and concerns linger over pre-leasing activity for many of these developments. Top among concerns is whether demand has picked up enough to justify the addition of new supply or if tenants are simply shuffling from existing space to new space. At the national level, new office construction activity was up nearly 25.0% in the second quarter compared to the year prior and up over 100.0% compared to its recent nadir. Several major office projects are currently underway within the Twin Cities market that will test the depth and breadth of demand for office space. Regardless, given the length of the office development cycle, vacancy rates at both the national and local levels should continue to decline at a modest clip at least over the next six months, putting upward pressure on rents.

Retailers Vacancy Rates Expected to Decrease

Conditions in the retail market are moving in the right direction in spite of structural shifts in consumer preferences. Limiting competition for existing inventory, a relatively narrow construction pipeline in the retail sector should support vacancy compression and spur rent growth in the second half of 2015. Consumer spending and retail sales are forecasted to increase over the next 12 month, which should help support demand for space in the retail sectors, as retailers become more confident in potential expansion plans and the pace of store closings decelerates. Retail vacancy rates are projected to decrease 30 to 50 basis points compared to the prior year at the national level, while year-over-year rent growth is forecasted to exceed 2.0% by the close of 2015. Trends in the Twin Cities retail market will closely mirror trends observed at the national level.

Hotel Industry Activity Ticks Upward

Occupancy, average daily room rates, and RevPAR, three of the most closely followed metrics in the hotel industry, all demonstrated improvement in the first half of 2015. Adverse weather conditions served as potential headwinds in the opening months of 2015 for some markets, yet leisure travel levels ticked upward and have remained resilient to help pick up slack left from softer business travel figures. National hotel occupancy rates are projected to increase from 64.4% in 2014 to the low-to-mid 65.0% range for year-end 2015. In turn, stronger occupancy levels are expected to facilitate average daily room rate and RevPAR growth in excess of 5.0% year-over-year by the close of 2015.

Driven by stronger occupancy and room rates, hotel development and investment activity continues to gain momentum in the Twin Cities market. An entity related to New Orleans-based HRI Lodging purchased the Plymouth Building in downtown Minneapolis in May of 2015 for $20 million, with plans to renovate the property into a 290-room hotel. Meanwhile, a host of new hotel projects are already under construction or remain in the planning or proposal phase, including a new luxury hotel at Terminal 1 of the Minneapolis-St. Paul International Airport. On the investment front, Summit Hotel Properties closed on the its latest transaction in the Twin Cities market with the planned acquisition of the new Hampton Inn and Suites closing in April of 2015. Located at the southeast corner of Eighth Street North and First Avenue North in downtown Minneapolis, one block south of Target Center, the 211-room, limited-service hotel sold for $39 million or approximately $184,834 per room.

Stronger Fundamentals and Current Pricing Trends are Igniting Development Activity

Improving operating fundamentals, favorable financing, and sale prices exceeding previous peak levels are driving the pace of new construction activity. The breadth and depth of construction activity has increased across property types and markets. New construction activity has become increasing robust in primary markets, but activity is spilling over into secondary and even tertiary markets. While activity is strongest within the apartment and industrial sectors, development is also becoming more widespread across other major and niche property types. Further, rising construction spending and overall activity is being supported by both private and public development. As an example of these trends, the Department of Homeland Security broke ground in the second quarter of 2015 on an $835 million, 574,000-square-foot National Bio and Agro-Defense facility in Manhattan, Kansas. More locally, while headlines have been focused on the robust apartment construction pipeline in the Twin Cities, development activity remains strong and diverse in several outstate markets, including the Mankato area.

Commercial RE Transaction Activity Strong

Healthy operating fundamentals, a low interest rate environment, increasing investor allocations towards real estate, and the relative stability of the United States drove activity in the commercial real estate market through the first half of 2015. Progress among operating fundamentals and improvements on the spatial side of the equation have been notable, yet strong transaction volume is highlighting the strength of the commercial real estate market.

At the national level, sale transaction velocity has remained healthy, but strong sales volume in the last several quarters has been supported by a number of portfolio and entity-level transactions, which are occurring across all property types. In April of 2015, Prologis, as part of a joint venture with Norges Bank Investment Management, announced the acquisition of a $5.9 billion portfolio from KTR Capital Partners. The portfolio includes 60 million square feet of industrial space contained within 322 properties as well as 3.6 million square feet of space currently under construction and a land bank that will accommodate up to nearly 7 million square feet of additional development.

In the office and retail sectors, portfolio and entity-level transactions have accounted for over 30.0% of year-to-date sales volume through the first six months of 2015. Transaction activity in the office and retail sectors is also being fostered by strong interest in sale-leaseback transactions. In May, an entity related to Chicago-based Mesirow Financial acquired a 1.4 million-square-foot corporate campus located in New Jersey in a $650 million sale-leaseback transaction. The sprawling corporate campus is leased to Verizon for an initial 20-year term that provides for options to renew or extend the lease. In June, TravelCenters of America agreed to sell 30 travel centers to Hospitality Properties Trust in a $397 million sale-leaseback transaction.

MN Experiences Strong CRE Activity

Similar to conditions at the national level, sales volume for commercial real estate assets remains healthy in the Twin Cities market. Although transaction velocity remained flat on a year-over-year basis, sales volume in the Twin Cities apartment market continues to be particularly strong, as investors do not appear overly concerned about the potential for fundamentals to be peaking. Through the first six months of 2015, year-to-date sales volume in the Twin Cities apartment market for conventional, market-rate 50+ unit apartment properties totaled approximately $285.5 million, up approximately 45.0% compared to the first half of 2014. Two sales involving Class ‘A’ properties in the urban core of Minneapolis accounted for over 30.0% of all sales volume in the Twin Cities apartment market during the first half of 2015, but the largest transaction involved a 402-unit suburban asset in the city of Woodbury, which sold for $54.25 million or nearly $135,000 per unit in May.

Real Estate Yields Attractive to Investors

Through at least the near-term, investors are likely to minimize exposure to bonds, and cash will continue to offer little to no return. Further, a negative return relative to even modest inflation offers investors little appeal to cash, and stocks remain at above-average valuations. Additionally, stock buybacks are becoming a more significant driver of earnings per share growth, indicating companies are struggling to identify long-term investments that will stimulate top-line growth. Significant risk exists within the stock market if multiples begin to compress and earnings growth becomes more sluggish. While current pricing does not reflect peak values for all markets, capitalization rates remain low and valuations for commercial real estate assets are strong compared to historical benchmarks, yet commercial real estate assets continue to have strong appeal to investors, due to favorable returns compared to investment alternatives and stronger upside as a result of improving market fundamentals.

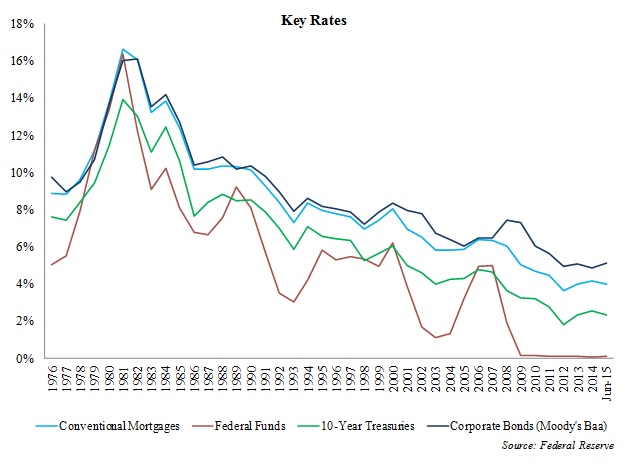
Global economic uncertainty and a likely rising interest rate environment domestically remain among the top concerns for the national commercial real estate market, yet both potential headwinds appeared to serve as an overall net positive for the industry in the first half of 2015. Concerns about the global economy are driving foreign investors in search of relative stability into the United States market, while commercial real estate assets continue to offer favorable yields and overall returns compared to other investment alternatives. Historically low rates and the availability of capital are also providing attractive financing opportunities, and key rates remain well below historic norms to support growth within the commercial estate market.

KeyRates

Capital Markets

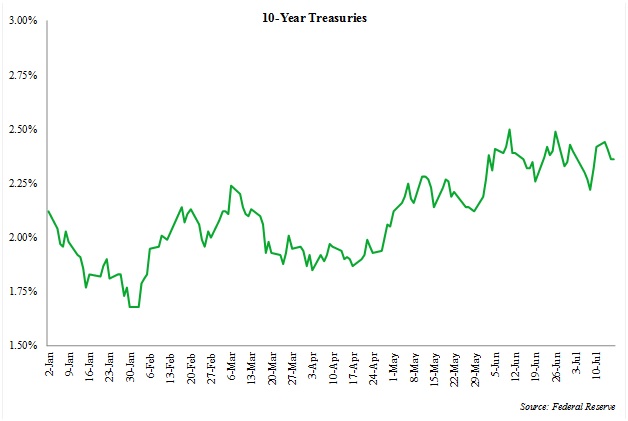
After reaching the most recent peak of 2.5% in mid-June, Treasuries rallied through the end of the second quarter and yields on 10-year Treasuries retreated to 2.35% at the close of June. Weak inflation and the relative stability of the United States are expected to prevent a massive exodus from investors in Treasuries, as events at the global level are putting a premium on safety. As a result, the 10-Year Treasury yield may demonstrate some volatility, due to the uncertainty of the Fed’s next steps, but is unlikely to increase significantly by the close of 2015. The following graph presents the year-to-date 10-year Treasury yield.

10YearTreasuries
Barring a dramatic or jarring increase in interest rates, strong investment demand for commercial real estate assets and a wider risk premium spread compared to historical norms are expected to hold cap rates at historic lows through the near-term. In addition to strong investment demand, the anticipated pace of interest rate hikes will still afford investors with a low cost of capital for a significant period and will likely be accompanied by a more optimistic economic outlook. As of the first quarter of 2015, the average capitalization rate spread over 10-year Treasuries stood at 436 basis points compared to a historical average spread of 384 basis points, while the average capitalization rate to corporate bond yield (Moody’s Baa) maintained a favorable relationship. A wider spread suggests that, even in a likely rising rate environment, the market could absorb some small shocks and maintain a low cap rate environment through spread compression, as risk spreads appear poised to narrow closer to historical patterns. The following graph presents historical average capitalization rates (all four major property types), 10-year Treasury yields, and corporate bond yields (Moody’s Baa).

RatesSpreads
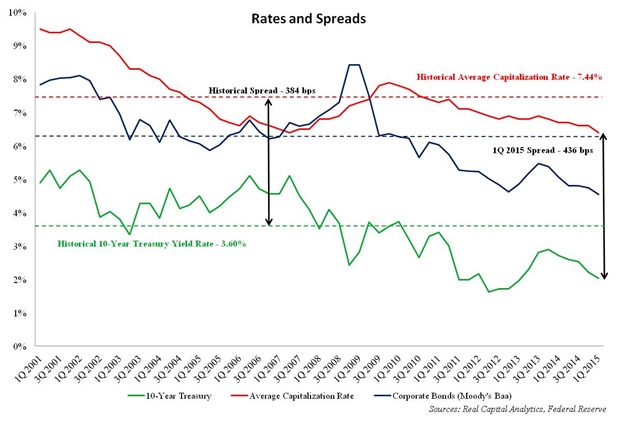
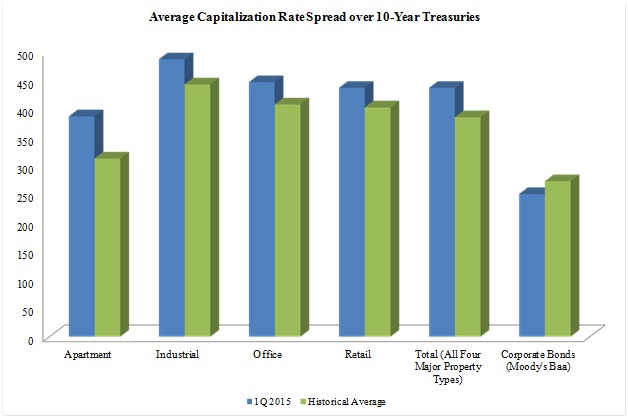
Among property types, the average capitalization rate spread over 10-Year Treasuries is widest compared to the historical average within the apartment sector, though spreads remain wider compared to historical among all four major property types. As of the first quarter of 2015, the spread within the apartment sector was 386 basis points compared to a historical average of 312 basis points. In comparison, the spread between yields on corporate bonds (Moody’s Baa) and 10-Year Treasuries, as of the first quarter of 2015, remained below the historical average. Competition among buyers for commercial real estate assets is expected to remain healthy in the final six months, and as a result of strong buyer interest and wider spreads, capitalization rates are likely to remain relatively unchanged from current levels by the close of 2015.

CapRate

Rate Liftoff by Fed Could Occur in December 2015

A majority of traders are assuming a rate liftoff by the Federal Reserve in December, but even while the economic outlook has improved, there is no certainty that rates will rise in 2015. Several recent comments made by members indicate the Fed will be more cautious of raising rates too early than too late. Recent analyses completed by Morgan Stanley and Deutsche Bank suggest the first rate hike will not occur until the first quarter of 2016. Moreover, the International Monetary Fund (IMF) urged the Federal Reserve in June to delay raising interest rates until the first half of 2016, after cutting its growth forecast for the second time in 2015. As of mid-July of 2015, the CME Fed Watch, a tool that helps gauge the market’s reaction to changes to the Federal Funds target rate, indicated the probability of a rate hike in September was 21.0% compared to 39.0% in October, 58.0% in December, and 74.0% in January of 2016. Overall, indicators suggest a realistic outlook is for the 10-Year Treasury yield to close the year in the mid-2.0% range before reaching up to 3.0% in 2016, as investor demand puts downward pressure on rates through the foreseeable future.

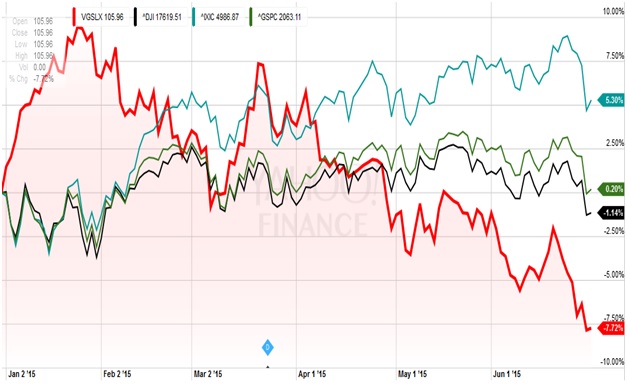
Public REITs Experience Declines

Lagging major indexes and renewed concerns regarding the threat of rising interest rates posed a significant challenge to the share prices of publicly-traded REITs in the second quarter of 2015, following a solid performance in the first three months of the year. While the case for operating fundamentals remains generally solid, concerns about rising rates, due to the sensitivity to bond markets, have created some jitters among investors. Shares in the Vanguard REIT Index Admiral Fund (VGSLX), one of the largest REIT mutual funds with over $46 billion in total net assets, declined 7.7% year-to-date at the end of June 2015. In comparison, the NASDAQ Composite Index was up 5.3% year-to-date at the close of the second quarter, while the S&P 500 remained essentially flat, up a mere 0.2% during this same period. The Dow Jones Industrial Average also declined in this six-month period, shedding just over 1.1% from the end of December of 2014 to the close of June of 2015. Given the broad-based decline in share prices among REITs, a number of REIT subsectors are trading at substantial discounts to their underlying net asset value. The following graph presents year-to-date performance of the Vanguard REIT Index Admiral Fund, Dow Jones Industrial Average, NASDAQ Composite Index, and S&P 500.

REITs

Hotel/Healthcare REITs Are Hit Hard

Hotel and healthcare REITs were among the hardest hit in the first half of 2015. Hotel REITs have primarily struggled due to concerns of an oversupply, while healthcare REITs have been hit hard as a result of investor perception of lower growth prospects compared to other REIT subsectors. Share prices of Ashford Hospitality Trust, Inc. (NYSE: AHT), Chesapeake Lodging Trust (NYSE: CHSP), and Host Hotels & Resorts, Inc. (NYSE: HST) all declined by more than 15.0% year-to-date at the close of the second quarter, while share prices of HCP, Inc. (NYSE: HCP), Sabra Health Care REIT, Inc. (Nasdaq: SBRA), and Healthcare Realty Trust Incorporated (NYSE: HR) were all also at least 15.0% lower at the close of June compared to year-end 2014. Residential REITs fared the best as a whole, with Home Properties Inc. (NYSE: HME), Essex Property Trust Inc. (NYSE: ESS), and UDR, Inc. (NYSE: UDR) all up over 2.0% year-to-date as of June 30, 2015. Home Properties, which agreed to be acquired by Lone Star Funds in an all-cash transaction valued at $7.6 billion in June, was up over 10.0% year-to-date at the close of the second quarter.

Market conditions appear ripe for additional consolidation within the REIT sector. Following the close of the second quarter, Chambers Street Properties (NYSE: CSG) announced an agreement to buy Gramercy Property Trust Inc. (NYSE: GPT) in an all-stock deal that is anticipated to close before the end of 2015. The merger will create one of the largest net lease REITs, with a combined portfolio including nearly 300 properties and approximately 52 million square feet of space. Parkway Properties, Inc. (NYSE: PKY) is also reported to be in the early stages of exploring strategic options, including a potential sale to another REIT or buyout firm.

Although publicly-traded REITs struggled in the first half of 2015, companies in even the hardest hit subsectors continued to pursue new acquisitions. Hotel REITs struggled mightily in the first half of 2015, as concerns over the expected amount of new supply to be delivered over the next 12 months mounted, yet transaction volume and acquisitions by publicly-trade hotel REITs remained strong in the first six months of 2015. Notable sales transactions included Host Hotels & Resorts, Inc. purchasing the Phoenician, a 643-room luxury resort at the base of Camelback Mountain in the Phoenix area, for $400 million, or roughly $622,100 per room, and the acquisition of the Four Seasons Hotel in downtown Austin for $197 million, or nearly $677,000 per room, by Strategic Hotels & Resorts, Inc. (HYSE: BEE).

Data referenced in this report was current as of July 17, 2015, and includes preliminary employment numbers as reported by the Bureau of Labor Statistics, which are subject to revision.

Market View Q1 2015

Economic and Real Estate Market Snapshot

In spite of lingering headwinds and a fresh set of challenges, the national economy continued to demonstrate overall moderate expansion through the first quarter of 2015, but several indicators suggest a slightly weaker pace of growth going forward.  Eight of twelve Federal Reserve Districts, including the Minneapolis District, reported modest or moderate growth, with the remaining four Districts reporting slightly expanding or steady conditions.  Growth has been spurred by improvements in the labor market and healthy consumer confidence.

U.S. employment gains

Non-farm employment at the national level increased by 2.3% year-over-year in March of 2015 on the net addition of nearly 600,000 jobs in the first three months of 2015.  Employment gains have been led by rising payroll figures within the goods-producing sectors, though increasing headcounts were also noted across the service-producing and government sectors.

Consumer confidence at eight-year high

Meanwhile, consumer confidence levels reached an eight-year high in the first quarter of 2015, peaking at 98.1 in January of 2015, as retail sales figures remained solid.  The following chart presents national retail sales figures and the Consumer Confidence Index through the first quarter of 2015.

 RetailConsumer

Global influences stall expansion

Although the national economy demonstrated overall progress in through the first three months of 2015, lingering global economic headwinds and setbacks resulting from falling energy prices held back further expansion.

Indicators show some pessimism, slower growth ahead

Several leading indicators painted a more pessimistic economic outlook and point toward a slightly milder pace of growth ahead.  The NFIB Small Business Optimism Index dropped approximately 5.1% at the close of the quarter after rising to 100.4 in December of 2014.  The Institute for Supply Management’s ISM Index also decreased through the first three months of 2015 and fell for the sixth consecutive month in March.  In addition, the Manufacturers Alliance/MAPI Composite Business Outlook Index also demonstrated some weakness.  While these indicators suggest a milder pace of growth going forward, it is important to note the NFIB Index reading of 95.2 in April of 2015 remains up compared to the year prior, and 15 of the 18 manufacturing industries reported growth in the latest ISM Report On Business.  Moreover, the MAPI Foundation Business Outlook in April of 2015 reported healthy capacity utilization and declining inventories, which lessens the risk of oversupply.

U.S. real estate market improving

Residential market: The national real estate market continued on an upward trend in the first quarter of 2015.  Conditions in the for-sale residential real estate market remain steady to slightly improving, but the declining availability of desirable inventory and harsh winter weather in some regions, notably the Northeast region, held back further improvements.

Commercial market: Fundamentals in the national multifamily market remained relatively strong across all regions, while most major markets noted improvements in the office, retail, and industrial sectors.  Improving fundamentals, attractive financing opportunities, and superior returns compared to alternative investments continue to attract capital into the commercial real estate market, with investors demonstrating a clear preference for properties in markets with diverse economies and technology hubs.  Foreign investors are playing a significant role in driving investment activity, but domestic institutions also have demonstrated a resilient appetite for commercial real estate assets.  The anticipation of rising interest rates remains one of the major concerns in the near term, but the outlook for the commercial real estate market remains optimistic, as user demand is projected to remain positive and facilitate healthy occupancy levels to further drive rent growth.

State of the State – Minnesota snapshot

Similar to conditions at the national level, the Minnesota economy demonstrated moderate growth in the first three months of 2015 despite recording somewhat mixed results during this period.

Employment: Minnesota layoffs

Target Corporation announced layoffs of 1,700 in March of 2015, while three iron ore facilities in northern Minnesota idled or reduced production in response to lower demand for steel, resulting in more than 1,100 layoffs.  In addition, turkey producers in the State were hit by an extremely lethal strain of bird flu, which resulted in layoffs.

Minnesota gains 13,400 jobs in 1st quarter

Overall non-farm employment at the statewide level increased by 1.80% year-over-year in March of 2015 on the net addition of approximately 49,400 jobs. The first three months of 2015 saw payroll figures statewide increase by 13,400.  More impressive, the state of Minnesota recaptured all of the jobs lost from the recent recession in the first quarter of 2013, a feat that some states have yet to accomplish as of the first quarter of 2015.

Job gains in education, health and hospitality sectors

Employment growth in the state of Minnesota during the first quarter of 2015 was led by the education/health services and leisure/hospitality sectors, which accounted for over 90.0% of all new jobs added between December of 2014 and March of 2015.  The following chart presents year-over-year non-farm employment growth in Minnesota.

nonFarm

Unemployment falling, still lower than U.S. figures

The unemployment rate in the state of Minnesota decreased to 4.50% in March of 2015, down 80 basis points from 5.30% reported 12 months prior, though up from the 4.4% posted in February of 2015.  The unemployment rate in the state of Minnesota continues to track below the national level, which reported an unemployment rate of 5.60% in March of 2015.  Labor markets in most Minnesota metropolitan areas remain relatively tight; the unemployment rate remains lowest the Mankato area (3.40%), followed by the Twin Cities (4.00%), Rochester (4.20%), St. Cloud (4.80%), and Duluth (5.60%).  The following chart presents unemployment rates for regional MSA markets, state of Minnesota, and the United States.

unemployment

Minnesota real estate markets are healthy

Supported by a diverse and expanding economic base, conditions in both the residential and commercial real estate markets at the statewide level remain healthy.

Residential permits up 46.7% from last year

Residential permitting activity through the first quarter of 2015 in the state of Minnesota increased by 46.7% compared to the first three months of 2014, while the value of residential permits increased by just over 40.0% during this same period.  In addition to new residential construction activity, the for-sale residential market continues to post rising median home sale prices and a stronger pace of sales velocity.  Multifamily residential construction activity remains relatively strong in the Twin Cities metropolitan area, particularly within the region’s core, but multifamily developers are also active in several outstate Minnesota markets.

Markets strong throughout Minnesota

Healthy occupancy levels and positive absorption are supporting rent growth in the Twin Cities apartment market, but conditions are also favorable in the Mankato, St. Cloud, and Rochester markets.  Commercial real estate markets continued to note progress in the first three months of 2015, as momentum in the industrial sector remains strong and the pace of improvements in the office and retail sectors accelerates.  In turn, developers are responding to capitalize on favorable market conditions and attractive financing opportunities, resulting in a wider commercial construction pipeline.  Given the dearth of new residential and commercial construction deliveries from 2009 to late 2011, new construction levels remain reasonable compared to historical norms, and as long as the economy continues to expand at a modest to moderate pace, the runway for value creation in the market appears relatively wide and long.

Real estate investors are optimistic

Investors are optimistic on the outlook for real estate in the Twin Cities metropolitan area and throughout much of the state of Minnesota. Relatively robust investment activity continued through the first quarter of 2015, as national institutional buyers became more aggressive in the market.

New record set in lodging sale

In February, Carey Watermark Investors, a New York-based REIT formed to make investments in the lodging and lodging-related sectors, purchased the 214-room Minneapolis Westin for $66.4 million or approximately $310,280 per key.  The deal for the Minneapolis Westin surpassed the previous Minneapolis record of $257,000 per key paid by Loews in the $65 million sale of the Graves 601, which closed in late 2014.

Other significant Minnesota transactions

In one of the largest industrial transactions during the first quarter of 2015, IRET announced a portfolio sale in March, which included four office showroom properties in the Twin Cities.  The four-property portfolio sold for $26.6 million or approximately $72.00 per square foot of total gross building area.  The four-property portfolio included Burnsville Bluffs II, a 45,019-square-foot asset in Burnsville; Whitewater Plaza, a 61,138-square-foot asset in Minnetonka; Southeast Tech Center, a 58,300-square-foot asset in Eagan; and Plymouth Tech I-V, representing a total of 205,494 square feet in Plymouth.

Investment activity in the office, retail, and multifamily markets also remained healthy in the first three months of 2015.  In March, Franklin Street Properties sold the Eden Bluff Corporate Center to Dougherty Real Estate Equity Advisors, LLC for $28 million or $182.97 per square foot.  The property, which is leased by C.H. Robinson Worldwide, Inc. through June of 2021, was purchased by Franklin Street in June of 2009 for approximately $22.57 million, indicating an annual rate of price appreciation of nearly 4.0%.

Notable activity in the multifamily sector included the sale of 222 Hennepin in March of 2015 to Weidner Apartment Homes, but healthy interest from investors and investment activity in the multifamily sector was also reported in several outstate markets.  A private Twin Cities-based investor purchased two apartment assets in the Mankato market during the first quarter of 2015.  In February of 2015, the 132-unit Sunrise Village Apartments in North Mankato, located in close proximity to South Central Technical College, sold for $6.15 million or approximately $46,591 per unit, and in March of 2015, the same private investor closed on the Woodside Apartments, located near the River Hills Mall.  The 101-unit Woodside Apartment complex sold for $11.66 million or approximately $115,446 per unit.

In the retail sector, an Illinois-based firm, Pinetree Commercial Realty, purchased the Village of Blaine for $38.3 million or approximately $173.00 per square foot.  Located in the eastern portion of Blaine, near the intersection of Lexington Avenue and Interstate 35W, the Cub Foods-anchored center sold at relatively healthy per pound price, considering that Wal-Mart has announced plans to relocate from existing space just east of the center.

Demonstrating that retailers remain relatively optimistic throughout the state, Fleet Farm purchased approximately 39 acres of land in Hermantown for $10.255 million, or roughly $6.00 per square foot of land area, in two transactions to accommodate the development of a new 183,000-square-foot store within the Hermantown Marketplace.  The retailer also opened an 183,600-square-foot store, along Highway 22 in Mankato, during the first quarter of 2015.

Data referenced in this report was current as of May 5, 2015, and includes preliminary employment numbers as reported by the Bureau of Labor Statistics, which are subject to revision.

Commercial Real Estate Snapshot: a Review of 2014

By: Brad Dulas

Supported by an improving economic outlook and employment growth, the commercial real estate market continued to note progress through the close of 2014. Although remaining relatively moderate, employment growth was experienced within most major markets and across most sectors during the year, as the unemployment rate continued to decline. Coastal markets and technology hubs recorded the most robust employment growth in 2014, while job growth within the Midwest region was led by the Chicago and Twin Cities markets. Non-farm employment in the Twin Cities metropolitan area increased 1.8% on the net addition of 32,100 jobs in 2014, and the area’s unemployment rate decreased by 100 basis points, falling from 4.3% in December 2013 to 3.3% in December 2014. Employment growth in the Twin Cities market was led by the manufacturing and professional/business service sectors during the year, though year-on-year payrolls increased across nearly all sectors.

Led by demand for logistics space, market conditions in the industrial sector at both the national and regional levels continued to improve in 2014, with strong absorption figures driving vacancy rates lower and putting upward pressure on asking rents. Closely mirroring trends at the national and regional levels, demand for industrial space in the Twin Cities market remained strong during the year, as vacancy rates declined and asking rents increased in the face of rising new construction activity. Although the outlook for the industrial market remains upbeat, lower oil prices and a stronger dollar could adversely affect demand and occupancy levels in markets dependent upon the energy sector and port activity. Favorable demographics and employment growth continue to drive strong apartment absorption figures, while macro-level trends, including hefty student debt levels, contributed to apartment demand throughout most of the nation, including the Twin Cities market. New apartment deliveries in the Twin Cities market began to weigh on occupancy levels within the Class ‘A’ segment during 2014, but overall the local apartment market remains healthy.

In spite of the progress made during the year, the rise of e-commerce and the pursuit of smaller footprints by retailers held back stronger growth in the retail sector at the national, regional, and local levels. While macro-level trends impacted demand, positive absorption figures fostered modest improvements in operating fundamentals. Similar to trends through most markets, the Class ‘A’ segment in the Twin Cities retail market has noted significant progress. While headwinds will continue to persist for the retail market, moderate demand and higher sales-per-foot trends will continue to facilitate improving market conditions. Paralleling the retail market, momentum continued to build in the office sector during the year. Although elevated, office vacancy rates trended downwards and asking rents advanced at the national, regional, and local levels in 2014. Smaller per employee space requirements by office users remain to be the largest obstacle facing the office sector, as the trend toward telecommuting appears to have lost some traction and businesses are gradually expanding headcounts. The Class ‘A’ and Central Business District segments are leading the Office sector recovery, but conditions are becoming ripe for the Class ‘B’ and Suburban segments to catch up in the months ahead.

CREIAFueled by the availability of financing and attractive yields relative to alternative investments, investors are optimistic about the outlook for commercial real estate. More capital is available in the market, boosting investor confidence, and the yields commercial real estate property is delivering remains favorable compared to alternative investments. Increasing by over 5.0% year-on-year in 2014, annual sales volume at the national level among the four major property types has risen for five consecutive years. Accounting for nearly 35.0% of all sales activity among the four major property types, rising sales volume was driven by the office sector during the year, while the biggest year-on-year increase in sales volume was noted within the retail sector. Strong fundamentals, favorable demographics, and a diverse employment and economic base continue to attract investors into the Twin Cities market. Property and portfolio sales of more than $2 million totaled approximately $3.8 billion in the local market during 2014, up roughly 20.0% from 2013. Mirroring national trends, sales volume in the Twin Cities was led by the office sector, which accounted for nearly 40.0% of all sales activity during the year. The apartment sector, however, posted the largest year-on-year increase in the local market.

Industrial

Demand

Led by demand for distribution space, the pace of absorption within the national industrial sector remained robust through all four quarters of 2014, marking the 19th consecutive quarter of positive net absorption. Absorbing over 150 million square feet during the year, absorption figures increased by nearly 10.0% compared to 2013. Demand was strongest within the Inland Empire, Chicago, Atlanta, Los Angeles, and Indianapolis markets. Although recording positive absorption within the light industrial and light manufacturing sectors, absorption continues to be driven demand for logistics space, as the continued emergence of e-commerce facilitates strong demand for warehouse and distribution space. Logistics users are focusing heavily on available space with 50×50 column spacing and clearance heights of at least 24 feet, with many distribution users seeking clearance heights of over 32 feet. Due to the region’s strategic location, lower cost of business, and other market-specific drivers, several markets within the Midwest region posted impressive absorption figures in 2014, including the Cincinnati and Cleveland markets. Surpassing historical norms, demand in the Twin Cities industrial market essentially kept pace with robust absorption noted in 2012 and 2013, with the strongest absorption figures noted in the Northwest submarket.

New Construction

Industrial developers continued to respond to strong demand by increasing the pace of new construction activity in 2014. New construction deliveries added over 110 million square feet to the national industrial inventory during the year, representing a year-on-year increase of approximately 60.0%. Construction activity was relatively healthy across most major markets, but the Inland Empire and Dallas-Fort Worth markets witnessed the greatest increases in inventory during the year. An additional 100 million square feet remain under construction, with the Atlanta, Dallas-Fort Worth, Chicago, and Houston markets possessing the widest industrial constrution pipelines. Approximately 15 million square feet remains under construction within the Atlanta market alone, including a number of large development projects in the South Atlanta submarket. Construction broke ground in the third quarter of 2014 on a 1.2 million-square-foot, build-to-suit, e-commerce center for Wal-Mart in Union City, and work is underway on 1.2 million-square-foot distribution center for Kroger on the grounds of the former Fort Gillem Army base. Developers continued to add new inventory within the Twin Cities industrial market in 2014, and broke ground on roughly 3.5 million square feet during the year.

Vacancy

Despite an accelerating pace of new construction activity, the vacancy rate in the national industrial market decreased by 50 basis points in 2014, falling below 8.0% at the close of the year. Occupancy levels have increased within most major markets, and vacancy rates remain incredibly tight among a number of markets in the West region, including the Orange County and Salt Lake City markets. Vacancy rates within the Midwest region remain tightest in the Indianapolis, Omaha, and Cincinnati markets. In spite of an active construction pipeline, the overall vacancy rate declined by 60 basis points within the Twin Cities industrial market in 2014.

Asking Rents

Fostering solid rent growth in 2014, roughly half of all major metropolitan markets noted rising asking rents during the year. Led by strong occupancy levels for logistics space, year-on-year asking rents were up over 2.5% in 2014, outpacing the 2.0% gain noted in the year prior. The pace of rent growth during the year was aggressive within the Nashville, South Florida, and Denver markets, and asking rent growth also remained strong among markets in the Northeast region, due to the increasingly limited availability of land suitable for industrial development in the region. Asking rents also improved across most major markets within the Midwest region, including the Twin Cities market.

Investment Activity

On the heels of a banner year in 2013, sales volume in the national industrial sector increased by approximately 13.0% in 2014 compared to the year prior, as sales volume in the industrial market exceeded $53 billion during the year. Sales activity remained strong for warehouse and distribution properties in 2014, but the light industrial sector noted the largest year-on-year gain in investment activity during the year. Comprising a significant portion of the nation’s annual total industrial sales volume, a number of major portfolio transactions closed in 2014, including a four-property portfolio containing nearly 1.65 million square feet of industrial space along major transportation corridors in northeastern Pennsylvania. KBS Realty Advisors sold the four-property portfolio to Chambers Street Group, a publicly traded REIT, in November of 2014 for $105.7 million or approximately $64.50 per square foot. Located along the Interstate 81 corridor, with close proximity to Interstates 78, 80, and 84, the properties are within a day’s drive of several major metropolitan markets and near three East Coast ports. All four of the properties have excess auto or trailer parking and two of the four buildings are expandable by up to nearly 400,000 square feet. The portfolio was purchased at a going-in cap rate of 7.6% on in-place income. One of the largest single property industrial transactions involved the sale of 14600 Innovation Drive, a 600,000-square-foot distribution facility located within the Inland Empire market. Situated within the Meridian Business Park, a 1,290-acre master-planned commerce center in the city of Riverside, the property sold for $43.8 million or $73 per square foot in October of 2014.

Apartment

Demand

In the face of an increasing pace of new construction activity, strong demand in the national apartment market continues to support tighter market fundamentals. Favorable demographics, employment growth, and macro-level trends serve as tailwinds and continue to drive apartment demand. Recording positive absorption across most major markets, demand for apartment units is strongest within the West and South regions. The Chicago, Columbus, and Indianapolis markets led apartment absorption in the Midwest region in 2014. Demand for apartment units remained healthy within the Twin Cities market for the fifth consecutive year in 2014, with absorption totaling nearly 12,000 units during this period.

New Construction

New construction added nearly 250,000 units to the national apartment inventory in 2014, up approximately 40.0% from the previous 12 months. Developers added nearly 20,000 units in the Washington D.C. market alone during the year, while new deliveries within the Dallas-Fort Worth, Houston, and Austin markets totaled roughly 45,000 units in 2014, as building activity remained brisk in the Texas markets. New apartment construction activity also picked up among a number of high-barrier-to-entry California markets and the pipeline in the Seattle market continued to expand. Activity in the Seattle market is concentrated in downtown Seattle, with construction underway on a number of ambitious development projects including a 355-unit, 41-story luxury apartment tower within the South Lake Union neighborhood. Multifamily starts and construction permitting figures at the national level surpassed the historical average in 2013 and permitting activity increased throughout 2014, indicating new apartment construction activity will remain strong through the near-term. New apartment construction volume in the Midwest region was led by the Twin Cities and Chicago markets.

Vacancy

Facilitated by strong demand, the vacancy rate in the national apartment market declined by 10 basis points during the course of 2014, falling from 4.3% in 2013 to 4.2% at the close of 2014. Since 2009, the vacancy rate at the national level has shed nearly 400 basis points. Due to healthy demand and limited new deliveries aimed at the lower tier segments, declining vacancy rates in the national apartment market during the year were heavily supported by strong occupancy levels at Class ‘B’ and Class ‘C’ properties. Meanwhile, the amount of new construction aimed at the luxury rental market weighed on vacancy rates within the Class ‘A’ segment. Apartment vacancy rates remain sub-3.0% in the New York City market and throughout the Bay Area markets of San Jose, San Francisco, and Oakland. Average vacancy rates remain below the market equilibrium of 5.0% in roughly 70.0% of the nation’s largest 50 markets. Apartment occupancy levels within the Midwest region are strongest in the Twin Cities, Chicago, and Cleveland markets. The average apartment vacancy rate within the Twin Cities market hovers in the low-3.0% range, with upward pressure within the Class ‘A’ segment beginning to weigh on overall vacancies.

Asking Rent

Outpacing the 3.2% gain noted in the year prior, the average asking rent in the national apartment market increased by 3.7% over the year ended in December of 2014. Although the overall asking rent increased during the year, effective rents within a number of primary markets demonstrated signs of weakness in 2014, yet positive effective rent growth was recorded in most secondary and tertiary markets. Asking rent growth remains healthy across all property classes, but effective rent growth is strongest within the lower-tier segments. The most robust rent growth in the Midwest region was noted in the Cincinnati market, though positive gains were posted within all major markets in the region. Besting asking rent growth at the national level, year-on-year asking rent growth was recorded for the fifth consecutive year in the Twin Cities market in 2014.

Investment Activity

While representing a modest year-on-year decline, sales activity within the national apartment sector remained healthy through 2014. Totaling roughly $100 billion, sales volume in the apartment sector accounted for nearly 30.0% of all sales activity among the four major property types. Since 2012, sales volume in the national apartment market has totaled just shy of $300 billion. Cap rates have compressed among all regions, but remain lowest within the Northeast and West regions, particularly among high-barrier-to-entry markets. Major sales transactions recorded during 2014 included Brookfield Property Partners purchase of a six-property portfolio within the New York City market for $1.04 billion in October of 2014. Containing nearly 4,000 units within upper Manhattan and Roosevelt Island, the portfolio previously sold for approximately $940 million in 2007. One of the largest single-property apartment sales transactions during the year involved the 492-unit, K2 Apartments in downtown Chicago, which sold in November of 2014 for $214.25 million or approximately $435,500 per unit.

Retail

Demand

Benefitting from increasing household wealth and consumer spending, healthy demand in the national retail market facilitated improving market fundamentals, as positive absorption was recorded all across product subtypes in 2014. Demand at the national level was strongest for community / neighborhood space, and particularly robust within the Dallas-Ft. Worth, Houston, Atlanta, and Phoenix markets. The Cincinnati, Detroit, and Milwaukee markets led absorption for retail space in the Midwest region. Aided by a strong half of the year, absorption remained positive in the Twin Cities market in 2014, with the strongest demand in the market recorded at neighborhood centers and specialty centers.

New Construction

Although relatively modest compared to other sectors, the pace of new retail construction activity increased in 2014, with developers increasingly focused on delivering new neighborhood center product. The most active markets for retail construction included the Northern New Jersey, Los Angeles, San Antonio, and Dallas markets. Significant new retail construction activity in the Dallas-Fort Worth market is underway in the north Dallas and Plano submarkets. Construction activity is expected to remain brisk within these markets through the near-term, but the most significant uptick in new supply volume will come within the Las Vegas market. Over half of all new retail space added within the Midwest region within 2014 was delivered within the Chicago and Kansas City markets.

Vacancy

Spurred by positive absorption, the average vacancy rate in the national retail market trended downward by 20 basis points in 2014. Vacancies remained below 6.0% in the regional mall and power center segments, with all segments now reporting average occupancy levels in excess of 90.0%. Among regions, retail occupancy levels are highest within the West and Northwest regions, with the San Diego and San Francisco markets noting the tightest market conditions. Occupancy levels in the San Diego market demonstrated healthy improvement during the year, as an increase in demand easily outweighed new deliveries. Fostered by positive absorption, the retail vacancy rate in the Twin Cities market decreased slightly in 2014, and remains favorable compared to other Midwestern markets.

Asking Rent

Asking rents in the national retail market advanced by 1.7% over the year ended in December of 2014, outpacing the 1.0% gain for the twelve months ending in December of 2013. The strongest asking rent growth during the year was posted within the San Francisco and South Florida markets, most notably within the Miami market. Rents in the Miami market have advanced significantly in recent years, with asking rents along Lincoln Mall swelling far past pre-recession levels. Retail asking rent growth throughout the Midwest remains modest compared to growth in the coastal and Texas markets, yet asking rents continue to inch upwards across most major markets within the region. Asking rent growth in the Twin Cities market has been bifurcated by asset class, with rents for Class ‘A’ product demonstrating healthy improvements and rent for Class ‘C’ product showing more modest progress.

Investment Activity

Comprising approximately 22.0% of all sales activity among the four major property types, sales volume in the national retail sector increased by nearly 20.0% year-on-year in 2014. Noteworthy sales transactions during the year within the national retail sector included a six-property portfolio along Lincoln Road Mall in Miami Beach and the Gucci Building in Beverly Hills. In one of the largest real estate transactions in the history of the South Florida region, Terranova Corporation and Arcadia Realty sold a six-property portfolio containing properties along the pedestrian-oriented Lincoln Road Mall in August of 2014 for $342 million or roughly $3,000 per square foot. The portfolio was sold to a joint venture consisting of Morgan Stanley Real Estate Investing and Terranova Corporation, which will remain a part owner in a newly formed entity. Built in the late 1930s, the Gucci Building sold in January of 2014 for a reported $108 million, which equates to sale price of nearly $8,000 per square foot. Located on the west side of Rodeo Drive, within the Golden Triangle of Beverly Hills, Gucci occupies the entire property on a triple-net lease, and according to reputable sources, the property traded at a cap rate of 3.75%. In one of the largest retail sale transactions in the Twin Cities market during the year, Woodbury Lakes sold for $64.5 million or approximately $176 per square foot in July of 2014. The seller in the transaction, RED Development, purchased the property out of foreclosure for $35 million in 2010.

Office

Demand

Although facing significant headwinds, momentum continues to build within the national office sector, as rising demand boosted year-on-year absorption figures by approximately 30.0% in 2014. Healthy demand in the national office sector lifted absorption figures up to levels not witnessed since 2006, with the strongest absorption recorded in the New York City, Houston, San Jose, San Francisco, and Chicago markets. The pace of office absorption within Central Business Districts outpaced absorption in Suburban counterparts, while a flight to quality supported the strongest demand within the Class ‘A’ segment. A number of major suburban markets did record sizeable increases in absorption figures, and demand for suburban office space in the Midwest region in 2014 was particularly healthy within the Kansas City market, with the Johnson County submarket absorbing nearly 850,000 square feet of office space during the year. Led by the Minneapolis CBD submarket, absorption figures in the Twin Cities office market demonstrated marked improvement compared to 2013, driving the market’s overall vacancy rate lower.

New Construction

Despite development activity remaining below historical norms, new national office construction deliveries increased by roughly 20.0% in 2014 compared to the year prior. An expanding office construction pipeline reflects rising confidence from developers and signals an accelerating pace of new construction activity through the near-term. The amount of office space under construction at the national level is up 75.0% compared to the year prior, with construction on nearly 105 million square feet of space underway. On the national level, new office construction activity is most robust within hubs in the West region, including the San Jose, San Francisco, and Seattle markets, and major metropolitan areas in the Northeast region, including the New York City and Philadelphia markets. Construction is underway on the Comcast Innovation and Technology Center in the City Center of Philadelphia, and upon completion, Comcast announced plans to occupy 1.33 million square feet of office space within the development.

Vacancy

Supported by positive absorption, the vacancy rate within the national office market declined by 60 basis points during the year, though the average office vacancy rate remains in the mid-15.0% range. Most markets reported occupancy gains during the year; however, the Miami, Phoenix, and Las Vegas markets have observed the most impressive gains over the last two years. Office vacancy rates slipped to a six-year low in Manhattan in 2014, and occupancy levels remain relatively strong within technology hubs along the West Coast and a number of secondary markets, including Pittsburgh and Nashville. Among markets in the Midwest region, vacancy rates remain tightest with the Twin Cities, St. Louis and Columbus markets. Falling into the mid-16.0% range at the close of 2014, the average vacancy rate in the Twin Cities office market decreased by 100 basis points during the year.

Asking Rent

Rent growth accelerated into the early stages of 2014 and then demonstrated signs of leveling off through the year. Year-on-year, the nation’s average office asking rent increased by approximately 4.0% in 2014, with the strongest growth recorded in the Central Business District subsector. Asking rent increases of over 5.0% year-on-year were noted across several markets, including the New York City, San Francisco, San Jose, San Francisco, and Chicago markets. Although most major metropolitan areas noted gains during the year, office rent growth remained subpar within most markets the Midwest region in 2014. Recording rent growth in excess of 3.0% during the year, the Chicago and Twin Cities office markets were noticeable exceptions among Midwestern markets.

Investment Activity

Accounting for nearly 35.0% of all sales activity among the four major property types, sales volume in the national office market increased year-on-year by approximately 15.0% in 2014, surpassing $115 billion during the year. Fostered by strong investor interest, the largest pricing gains during the year were recorded in the San Francisco, Washington D.C., Houston, and Boston markets. Notable office sales transactions during the year included 100 California Street in San Francisco and PNC Place in Washington D.C. Situated within the Financial District in San Francisco, 100 California Street sold for $182.25 million, or approximately $630 per square foot, in September of 2014, trading at a cap rate of 2.5% on actual figures. The buyer, a subsidiary of Fidelity Investments, planned to renovate the common areas of the building and reposition the asset for tenants in the technology sector. Located within the Central Business District in Washington D.C., two blocks from the White House, PNC Place sold for $392 million in October of 2014, topping the $1,000 per square foot barrier. The buyer was a joint venture between Norges Bank Investment Management and TIAA-CREF. Both properties were approximately 85.0% leased at the time of sale. Setting a new high water mark in the Twin Cities market, the Normandale Lakes Office Park sold for $368.95 million or approximately $217 per square foot in October of 2014. Containing 1.7 million square feet of space within five buildings along the Interstate 494 corridor, the property previously sold for just over $265 million in 2012.